MI Table Editing
Introduction
To edit a MapInfo table, firstly make sure the table is open in MapInfo set to Editable in Layer Control. For more information on this process please see Layer Control - editable.
Toolbars
The editing tool bars are shown below:
The upper toolbar contains the select, zoom, pan, information and a number of other icons. The green "i" symbol brings up the information cursor, this allows the user to click on an object to determine the data attributes of the layer. This useful for changing the attributes of the object.
In the second row of the image above the icons from left to right are:
- Point
- Line
- Polyline
- Arc
- Polygon
- Ellipse
- Rectangle
- Rounded Rectangle
- Text
- Frame (only available in Layout windows)
- Reshape
- Add vertex (node) to object
- Point Style
- Line Style
- Region Style
- Text Style
The arc, ellipse, rectangle and rounded rectangle should be avoided for TUFLOW modelling, use instead the point, line, polyline and polygon.
Adding An Object
To create a new object in the editable table, select the symbol for the object that you wish to add and start drawing in the Map Window. For a point object each click will add a new point. For a line click and hold at the start of the line, move the cursor and release to terminate the line. For polylines and polygons, start the object by digitising the objects with a left-click, each additional click will add a vertex. To finish drawing the object double click or use the escape key.
TIP: If you draw a vertex in the wrong location you can use the backspace button to undo the vertices.
For help digitising a line or polygon along a common boundary see this page.
Object Style
To change the style of an object you can set the style using the four style symbols before the object is drawn. To modify an object that already exists, select one or multiple object and then click on the relevant style symbol.
TIP: You can use this in combination with the select functions to good effect. For example, to colour code a 1d_nwk layer that contains a mixture of rectangular culverts (Type = "R") and pipes (type = "C") as line objects. You can follow the following to colour code these objects:
Select all pipes, by using the Query >> Select to select from the 1d_nwk table where Type = "C".
Change the line style using the Line Style button. Repeat to change other channel types (such as rectangular, irregular and bridge).
Modifying Object
To modify an object (move or add vertices), select the object, and click on the Reshape Icon, this will allow you to move the vertices. To add additional vertices, use the Add Vertices / Add Nodes icon. To delete an entire object, simply select the object and hit the delete key.
Attributes
Each object also has attribute data, the simplest way to view and modify the data is to click on the MapInfo "Info" tool, this is the green "i" in the upper toolbar above. Selecting this cursor types allows the user to click on any object and view / modify the properties.
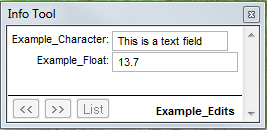
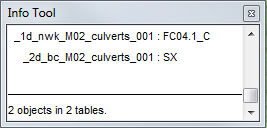
If only a single object is below the cursor, you will be taken to the attributes of that object (1st image below). If multiple objects are below the cursor the information window will display the object summary (see 2nd image). Clicking on one of these items will take you to the attribute of the selected object (1st image). Data can be manipulated in this view.
The data can also be viewed and manipulated in a tabulated format. To see the data in this format select Window >> New Browser Window and select the desired table. With the miTools this can be achieved by selecting an object from the desired table and selecting the "B" (browse) icon in the miTools toolbar:
![]()
For details on modifying the attribute data please see modifying data attributes. The allows you to modify the names, types, order and number of data attributes that the GIS object has.
| Up |
|---|


