Difference between revisions of "TUFLOW Viewer - Map Outputs - Vertical Profile"
Jump to navigation
Jump to search
Chris Huxley (talk | contribs) |
Chris Huxley (talk | contribs) |
||
| Line 25: | Line 25: | ||
<br><br> | <br><br> | ||
| − | |||
| − | |||
| − | |||
| − | |||
| − | |||
| − | |||
| − | |||
| − | |||
| − | |||
| − | |||
| − | |||
| − | |||
| − | |||
| − | |||
| − | |||
| − | |||
| − | |||
{{Tips Navigation | {{Tips Navigation | ||
| − | |uplink=[[TUFLOW_Viewer# | + | |uplink=[[TUFLOW_Viewer#Map_Output| Back to TUFLOW Viewer Main Page]] |
}} | }} | ||
Latest revision as of 14:57, 2 June 2021
Tool Description
This tool plots a result profile down the water column at a given location. For 2D depth average results (e.g. TUFLOW Classic / HPC) this will be a single value down the column. Users can choose one or multiple result types to plot at once.
To use the tool:
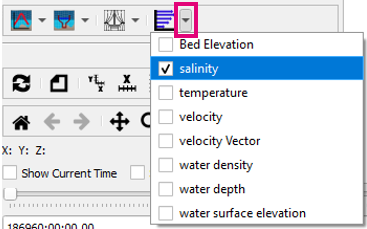
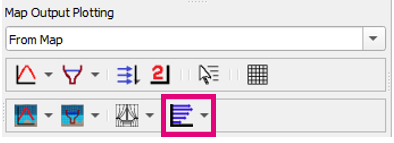
- Select which result type to plot using the down arrow next to the vertical profile plot icon in the toolbar.
- Click off the drop down menu somewhere in a blank section of the TUFLOW Viewer toolbar.
- Click the vertical profile icon so that it becomes indented and the cursor changes to a crosshair.
- Left click a location on the results to extract a vertical profile.


Interpolating the vertical profile can be toggled on/off in Settings >> Options >> Plotting and toggling Interpolate Vertical Profile. It can also be useful to turn on the Vertical Mesh when using the vertical profile plot. See the relevant link at the bottom of this page for information on the vertical mesh.

Interpolated Vertical Profile Example

Uninterpolated Vertical Profile Example

Example

| Up |
|---|