Difference between revisions of "TUFLOW SWMM Tutorial M02 Results QGIS"
Jump to navigation
Jump to search
Chris Huxley (talk | contribs) (Created page with "==QGIS Result Viewing== <ol> <li>Open TUFLOW Viewer from the TUFLOW Plugin toolbar.<br> <br> File:tuflow_plugin_tuflow_viewer.png<br> <br> <li>Open the simulation results....") |
Chris Huxley (talk | contribs) |
||
| Line 5: | Line 5: | ||
[[File:tuflow_plugin_tuflow_viewer.png]]<br> | [[File:tuflow_plugin_tuflow_viewer.png]]<br> | ||
<br> | <br> | ||
| − | <li>Open the simulation results. | + | <li>Open the simulation results. Select File > 'Load Results'. Navigate to the '''TUFLOW\runs''' folder and select '''TS02_5m_001.tcf'''. |
| − | + | will load to the Layers Panel: | |
| − | + | :*'''TS02_5m_001_swmm_ts_P''': 1D SWMM node junction and outlet water level results | |
| − | |||
| − | :*'''TS02_5m_001_swmm_ts_P''': 1D SWMM | ||
:*'''TS02_5m_001_swmm_ts_L''': 1D SWMM conduit flow results | :*'''TS02_5m_001_swmm_ts_L''': 1D SWMM conduit flow results | ||
:*'''TS02_5m_001_PLOT_P''': 1D ESTRY and 2D plot output water level and velocity results ('''Note:''' There are no ESTRY results from this simulation) | :*'''TS02_5m_001_PLOT_P''': 1D ESTRY and 2D plot output water level and velocity results ('''Note:''' There are no ESTRY results from this simulation) | ||
:*'''TS02_5m_001_PLOT_L''': 1D ESTRY and 2D plot output flow results ('''Note:''' There are no ESTRY results from this simulation) | :*'''TS02_5m_001_PLOT_L''': 1D ESTRY and 2D plot output flow results ('''Note:''' There are no ESTRY results from this simulation) | ||
:*'''TS02_5m_001''': 2D TUFLOW Results | :*'''TS02_5m_001''': 2D TUFLOW Results | ||
| − | |||
| − | |||
| − | |||
| − | |||
<br><br> | <br><br> | ||
| − | + | ||
| − | + | ==Pipe Flow Results== | |
| + | |||
| + | |||
<li>In the QGIS Layers Panel, right click '''TS02_5m_001_swmm_ts_L''' and select 'Zoom to Layer(s)'. | <li>In the QGIS Layers Panel, right click '''TS02_5m_001_swmm_ts_L''' and select 'Zoom to Layer(s)'. | ||
| − | + | <li>Use the 'Select Features' tool to highlight pipes within the network. Hold Shift in on the keyboard to enable selection of multiple objects. | |
| − | <li>Use the 'Select Features' tool to highlight | ||
<li>Click on the 'Flow' dataset under the Result Type in the TUFLOW Viewer 'Time Series' list. | <li>Click on the 'Flow' dataset under the Result Type in the TUFLOW Viewer 'Time Series' list. | ||
| − | <li> | + | '''<<video>>''' |
| − | < | + | <li>In the QGIS Layers Panel, right click '''TS02_5m_001_swmm_ts_P''' and select 'Zoom to Layer(s)'. |
| − | + | <li>Use the 'Select Features' tool to highlight node junctions within the network. Hold Shift in on the keyboard to enable selection of multiple objects. | |
| + | <li>Click on the 'Lateral Inflow' and 'Total Flow' dataset under the Result Type in the TUFLOW Viewer 'Time Series' list. | ||
| + | :: 'Lateral Inflow' represents the flow entering the network via the 1D/2D pit connection with the surface. | ||
| + | :: 'Total Inflow' is the sum of all flows, including flows from the 1D/2D pit and upstream 1D pipe connections | ||
| + | '''<<video>>''' | ||
</ol> | </ol> | ||
| Line 33: | Line 32: | ||
| − | == | + | ==Pipe Long-section Results== |
| + | |||
{{Tips Navigation | {{Tips Navigation | ||
|uplink=[[TUFLOW_SWMM_Tutorial_M02#Check_Files_and_Results_Output| Back to TUFLOW SWMM Tutorial 2]] | |uplink=[[TUFLOW_SWMM_Tutorial_M02#Check_Files_and_Results_Output| Back to TUFLOW SWMM Tutorial 2]] | ||
}} | }} | ||
Revision as of 15:33, 18 December 2023
QGIS Result Viewing
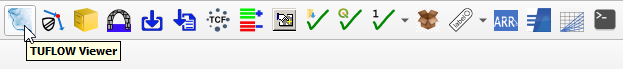
- Open TUFLOW Viewer from the TUFLOW Plugin toolbar.
- Open the simulation results. Select File > 'Load Results'. Navigate to the TUFLOW\runs folder and select TS02_5m_001.tcf.
will load to the Layers Panel:
- TS02_5m_001_swmm_ts_P: 1D SWMM node junction and outlet water level results
- TS02_5m_001_swmm_ts_L: 1D SWMM conduit flow results
- TS02_5m_001_PLOT_P: 1D ESTRY and 2D plot output water level and velocity results (Note: There are no ESTRY results from this simulation)
- TS02_5m_001_PLOT_L: 1D ESTRY and 2D plot output flow results (Note: There are no ESTRY results from this simulation)
- TS02_5m_001: 2D TUFLOW Results
Pipe Flow Results
- In the QGIS Layers Panel, right click TS02_5m_001_swmm_ts_L and select 'Zoom to Layer(s)'.
- Use the 'Select Features' tool to highlight pipes within the network. Hold Shift in on the keyboard to enable selection of multiple objects.
- Click on the 'Flow' dataset under the Result Type in the TUFLOW Viewer 'Time Series' list. <<video>>
- In the QGIS Layers Panel, right click TS02_5m_001_swmm_ts_P and select 'Zoom to Layer(s)'.
- Use the 'Select Features' tool to highlight node junctions within the network. Hold Shift in on the keyboard to enable selection of multiple objects.
- Click on the 'Lateral Inflow' and 'Total Flow' dataset under the Result Type in the TUFLOW Viewer 'Time Series' list.
- 'Lateral Inflow' represents the flow entering the network via the 1D/2D pit connection with the surface.
- 'Total Inflow' is the sum of all flows, including flows from the 1D/2D pit and upstream 1D pipe connections

Pipe Long-section Results
| Up |
|---|