TUFLOW Viewer - Time Series Outputs - Plotting Time Series
Revision as of 22:40, 7 April 2021 by Ellis Symons (talk | contribs)
Tool Description
The below steps outline how to plot a time series graph from time series outpupts:
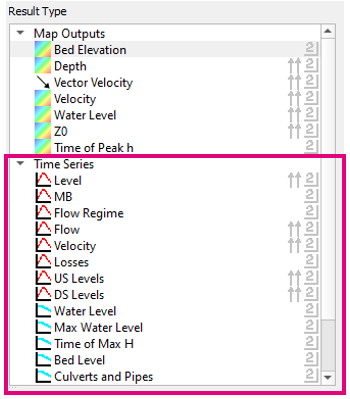
- Select a result type from the Time Series section - available time series result types will have a time series icon
 to the left
- Select a feature in one of the _PLOT_ GIS layers
