Difference between revisions of "TUFLOW 2D Hydraulic Structures"
Chris Huxley (talk | contribs) |
Chris Huxley (talk | contribs) |
||
| Line 27: | Line 27: | ||
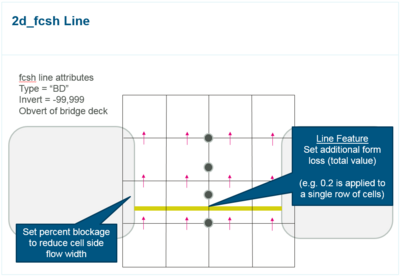
<li>Digitise <font color="blue">2d_lfcsh</font> or <font color="blue">2d_fcsh_</font> inputs using either a line or polygon feature. When applying form loss coefficients the best approach is to view the structure as a collection of 2D cells representing the whole structure, rather than being too specific about the representation of each individual cell: | <li>Digitise <font color="blue">2d_lfcsh</font> or <font color="blue">2d_fcsh_</font> inputs using either a line or polygon feature. When applying form loss coefficients the best approach is to view the structure as a collection of 2D cells representing the whole structure, rather than being too specific about the representation of each individual cell: | ||
* Line features will apply the form loss value to a single row of cells across the waterway. The TUFLOW form loss input should be entered representing the total value (eg. FC = 0.2). | * Line features will apply the form loss value to a single row of cells across the waterway. The TUFLOW form loss input should be entered representing the total value (eg. FC = 0.2). | ||
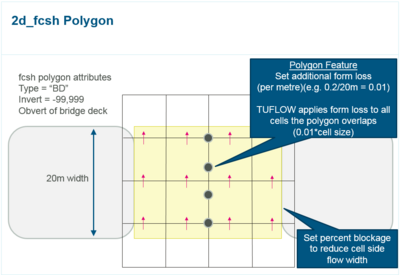
| − | * Polygon features will distribute the form loss between multiple cells across the width of the bridge and across the waterway. Due to this, the TUFLOW form loss input should be entered as the total value per unit width in the direction of flow (eg. FC = 0.2/20m = 0.01).</li> | + | * Polygon features will distribute the form loss between multiple cells across the width of the bridge and across the waterway. Due to this, the TUFLOW form loss input should be entered as the total value per unit width in the direction of flow (eg. FC = 0.2/20m = 0.01). |
| + | |||
| + | [[File:fcsh_line.PNG|400px]][[File:fcsh_polygon.PNG|400px]] | ||
| + | |||
| + | </li> | ||
<li> Flow widths (conversely, blockage factors) and flow height should be updated in the <font color="blue">2d_lfcsh</font> or <font color="blue">2d_fcsh_</font> inputs. This information is used to refine the structures flow area when the model grid resolution isn't fine enough to accurately do so already. | <li> Flow widths (conversely, blockage factors) and flow height should be updated in the <font color="blue">2d_lfcsh</font> or <font color="blue">2d_fcsh_</font> inputs. This information is used to refine the structures flow area when the model grid resolution isn't fine enough to accurately do so already. | ||
<li>The head loss across key structures should be reviewed, and if necessary, benchmarked against other methods (Recorded calibration data, HEC-RAS). Note that a well-designed 2D model will be more accurate than a 1D model, provided that any “micro” losses are incorporated.</li> | <li>The head loss across key structures should be reviewed, and if necessary, benchmarked against other methods (Recorded calibration data, HEC-RAS). Note that a well-designed 2D model will be more accurate than a 1D model, provided that any “micro” losses are incorporated.</li> | ||
Revision as of 10:31, 24 September 2015
2D Structure Modelling Theory
This webinar by Jessica Jefferys and Bill Syme (the TUFLOW Developer) discusses 2D structure modeling using the XP2D modeling framework. This is analogous to TUFLOW modeling since TUFLOW is the 2D engine within XP2D. The webinar topics include:
- An overview of hydraulic modelling theory
- Modelling bridges in 1D
- Modelling bridges in 2D
- Modelling buildings and fences
- XP2D model demonstration (NOTE: TUFLOW is the 2D engine for XP2D)
Webinar Link: Modelling Structures in Floodplains
2D Bridge Modelling in TUFLOW
The TUFLOW 2D solution automatically predicts the majority of “macro” losses due to the expansion and contraction of water through a constriction, or around a bend, provided the resolution of the grid is sufficiently fine (Barton, 2001; Syme, 2001; Ryan, 2013). Where the 2D model is not of fine enough resolution to simulate the “micro” losses (e.g. from bridge piers, vena contracta, losses in the vertical (3rd) dimension), additional form loss coefficients and/or modifications to the cells widths and flow height need to be added. 2D flow constriction commands/layers are the recommended approach for this purpose:
- Read GIS FC Shape == 2d_lfcsh_
- Read GIS Layered FC Shape == 2d_fcsh_


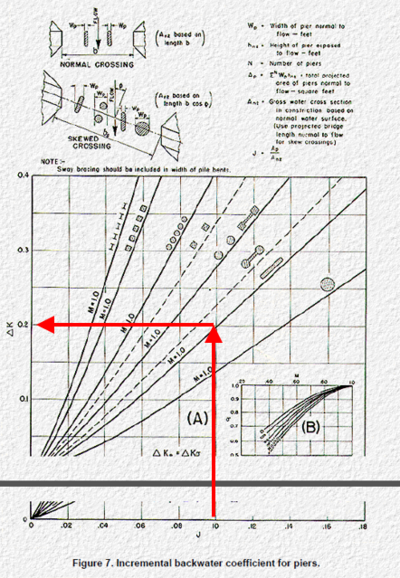
Form loss coefficients are an important input to the flow constriction layers. TUFLOW form loss coefficients can be derived from information in publications such as Hydraulics of Bridge Waterways (FHA, 1978).
Backwater caused by piers in a bridge constriction is dependent on the ratio of the pier area relative to the gross area of the bridge opening, the type of piers (or piling in the case of pile bents) and the angularity of the piers with the direction of flood flow. The FHA (1978) guidance advises what form loss coefficient should be adopted based on these input parameters.
- Calculate the ratio of the water area occupied by piers to the gross water area of the constriction (both based on the normal water surface) and the angularity of the piers. These inputs are used to calculate "J" in the FHA documentation.
- Use the FHA (1978) Incremental Backwater Coefficient for Piers data to calculate Kp. This is the value which will be entered into TUFLOW as the form loss coefficient.
- Digitise 2d_lfcsh or 2d_fcsh_ inputs using either a line or polygon feature. When applying form loss coefficients the best approach is to view the structure as a collection of 2D cells representing the whole structure, rather than being too specific about the representation of each individual cell:
- Line features will apply the form loss value to a single row of cells across the waterway. The TUFLOW form loss input should be entered representing the total value (eg. FC = 0.2).
- Polygon features will distribute the form loss between multiple cells across the width of the bridge and across the waterway. Due to this, the TUFLOW form loss input should be entered as the total value per unit width in the direction of flow (eg. FC = 0.2/20m = 0.01).
- Flow widths (conversely, blockage factors) and flow height should be updated in the 2d_lfcsh or 2d_fcsh_ inputs. This information is used to refine the structures flow area when the model grid resolution isn't fine enough to accurately do so already.
- The head loss across key structures should be reviewed, and if necessary, benchmarked against other methods (Recorded calibration data, HEC-RAS). Note that a well-designed 2D model will be more accurate than a 1D model, provided that any “micro” losses are incorporated.
- TUFLOW check files should also be reviewed to confirm that the correct form losses are being applied.
- The flow area through the structure should also be reviewed.If the overall structure flow area is not correct, then the velocities within the structure will not be correct and therefore the energy losses due to the changes in velocity direction and magnitude and additional form losses will not be well modelled.
- Digitise a Plot Output QA line (Read GIS PO == 2d_po_...) through the structure from bank to bank, and use this output to cross-check the flow area of the 2D FC cells is appropriate (the QA line will take into account any adjustments to the 2D cells due to FC obverts and changes to the cell side flow widths).

