EXCEL Tools Plot 1D Results
Jump to navigation
Jump to search
When you have 1D results open, select the Plot 1D Results option.
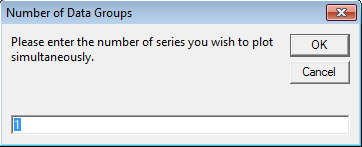
You will be asked to input the number of series that you wish to plot simultaneously, chose an appropriate number and select OK.

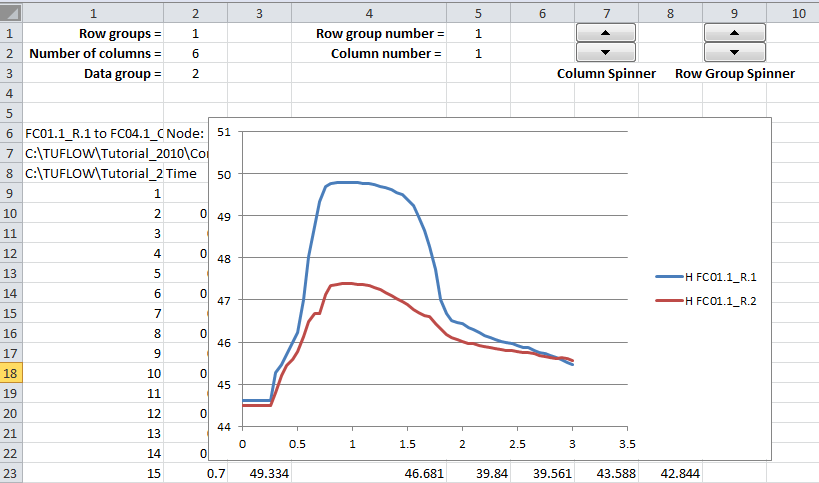
Additional rows will be added to the top of the sheet, and a chart is created. The Column Spinner can be used to cycle through the data columns in the chart. The Row Group Spinner can be used for large models where the 1D results are split over multiple rows (more than 256 columns).

| Up |
|---|