MI 1D Result Viewer
Jump to navigation
Jump to search
The TUFLOW Productivity Utilities (miTools) use the _TS GIS layer to plot 1D time-series results. Three examples are provided below.
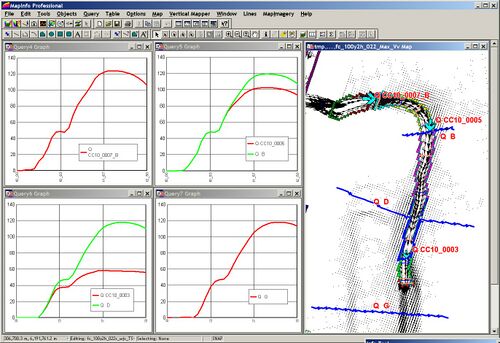
- The program can be used to summarise the peaks and time of peaks for all series within an active Graph Window.
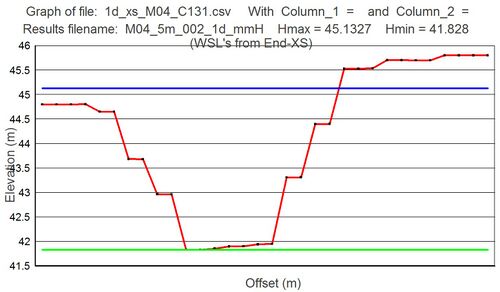
- The peak water level results within a _1d_mmH layer may be plotted along with the cross-sectional data:
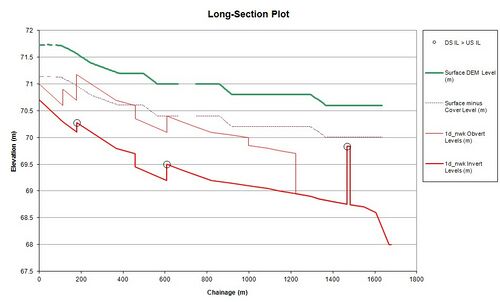
- Long-section plots can be generated on a specified downstream reach of the 1d_nwk GIS layer. The tool will prompt the user for a DEM in which to extract a ground surface profile before plotting the long-section in Excel. This tool is particularly useful for viewing the results of a pipe network.