Difference between revisions of "TUFLOW 2D Cell Size Selection"
Chris Huxley (talk | contribs) |
Chris Huxley (talk | contribs) |
||
| Line 9: | Line 9: | ||
= Test Case 1 = | = Test Case 1 = | ||
| − | This test case has been sourced from the <u>[https://www.tuflow.com/Download/Publications/UK%20EA%202D%20Benchmarking%20Results.TUFLOW%20Products%202017-09.pdf UK Environment Agency 2D Hydraulic Model Benchmark Test dataset]</u>. It is referred to as Test 5 in the Environment Agency (EA) dataset. The EA designed to simulate flood wave propagation down a river valley following the failure of a dam. The valley DEM is ~0.8 km by ~17 km and the valley slopes downstream on a slope of ~0.01 in its upper region, easing to ~0.001 at lower elevations. The model uses a single manning n value of 0.04 across the entire domain. | + | This test case has been sourced from the <u>[https://www.tuflow.com/Download/Publications/UK%20EA%202D%20Benchmarking%20Results.TUFLOW%20Products%202017-09.pdf UK Environment Agency 2D Hydraulic Model Benchmark Test dataset]</u>. It is referred to as Test 5 in the Environment Agency (EA) dataset. The EA designed to simulate flood wave propagation down a river valley following the failure of a dam. The valley DEM is ~0.8 km by ~17 km and the valley slopes downstream on a slope of ~0.01 in its upper region, easing to ~0.001 at lower elevations. The model uses a single manning n value of 0.04 across the entire domain. |
| − | |||
The model topography, EA reporting points and the simulation inflow hydrograph is shown below. <br> | The model topography, EA reporting points and the simulation inflow hydrograph is shown below. <br> | ||
[[File:Mesh_Converge_Model_Description_001.png|500px]] | [[File:Mesh_Converge_Model_Description_001.png|500px]] | ||
| − | [[File:Mesh_Converge_Model_Elevation_001.png|500px]] | + | [[File:Mesh_Converge_Model_Elevation_001.png|500px]]<br> |
| − | [[File:Mesh Converge Model Inflow 001.png|500px]] | + | |
| + | The model has a single inflow at the top of the catchment. <br> | ||
| + | [[File:Mesh Converge Model Inflow 001.png|500px]]<br> | ||
| + | [[File:Mesh_Converge_SMS_0.5hr.png|500px]] | ||
| + | [[File:Mesh_Converge_SMS_1.5hr.png|500px]]<br> | ||
The EA benchmark testing original assumed a 50m cell resolution. For the purpose of this assessment a range of cell sizes from 10m to 300m have been used to determine the impact changing cell size has on the model result. | The EA benchmark testing original assumed a 50m cell resolution. For the purpose of this assessment a range of cell sizes from 10m to 300m have been used to determine the impact changing cell size has on the model result. | ||
Revision as of 13:26, 16 August 2018
This page is currently under construction.
Introduction
This page of the TUFLOW Wiki discusses 2D cell size convergence. Cell size convergence refers to the tendency for model results to trend towards a common answer as cell size decreases. This behaviour occurs due to topographic features that influence the hydraulic flow behaviour better approximating reality as resolution increases. The series of creek cross-section images below demonstrate this. As model resolution increases from 20m to 5m the modelled topography progressively matches the real-world geometry more closely.

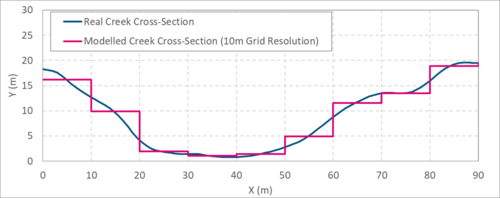

Unfortunately it isn't practical for all models to be designed at an infinitely fine resolution due to the cost it has on simulation speed. Increasing a model resolution will make a simulation run slower. As a rule of thumb, halving the cell size in a model will typically increase the simulation run time by a factor 8. This is due to the number of cells increasing by a factor of (4) four and the necessity for a calculation timestep half that of the larger resolution, translating to (2) twice the number of calculations (4 x 2 = 8). The challenge for modellers is knowing what resolution is necessary to achieve results that are fit for purpose with sufficient accuracy. This Wiki page uses two test cases to discuss this topic.
Test Case 1
This test case has been sourced from the UK Environment Agency 2D Hydraulic Model Benchmark Test dataset. It is referred to as Test 5 in the Environment Agency (EA) dataset. The EA designed to simulate flood wave propagation down a river valley following the failure of a dam. The valley DEM is ~0.8 km by ~17 km and the valley slopes downstream on a slope of ~0.01 in its upper region, easing to ~0.001 at lower elevations. The model uses a single manning n value of 0.04 across the entire domain.
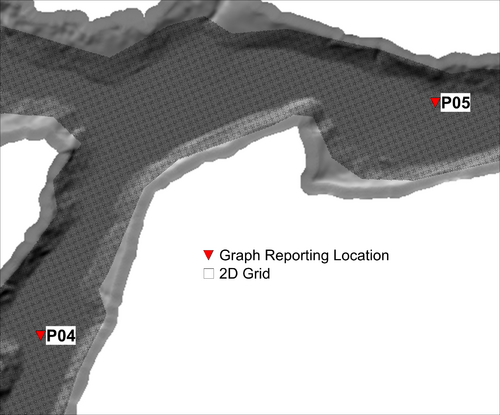
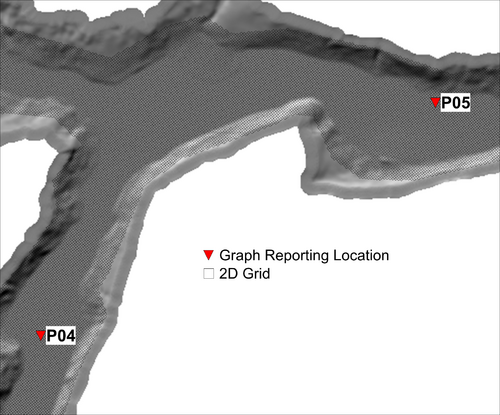
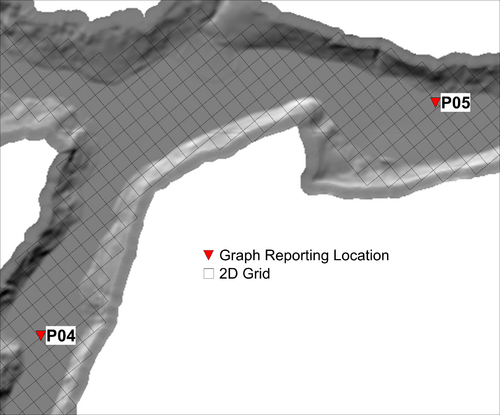
The model topography, EA reporting points and the simulation inflow hydrograph is shown below.


The model has a single inflow at the top of the catchment.

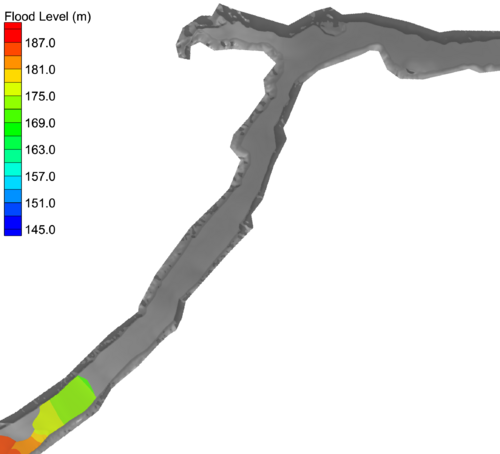
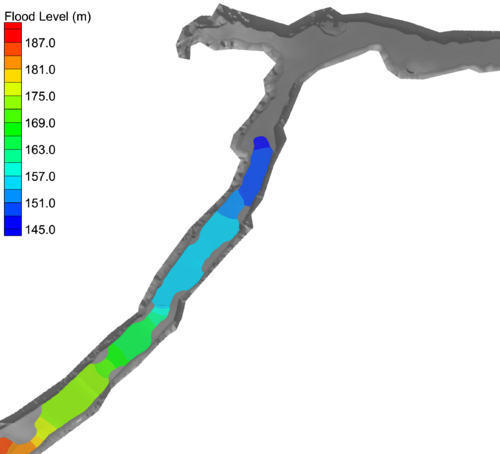
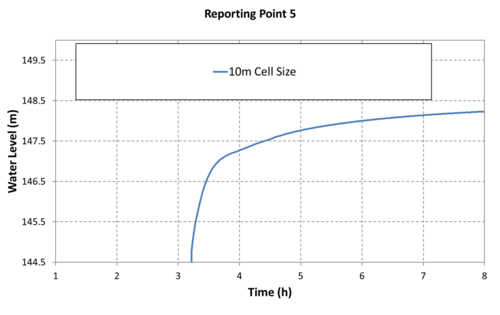
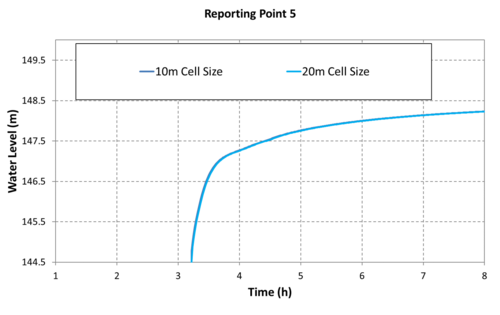
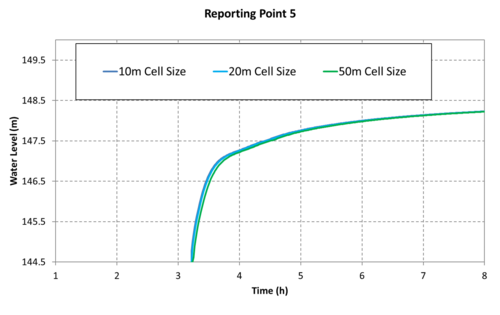
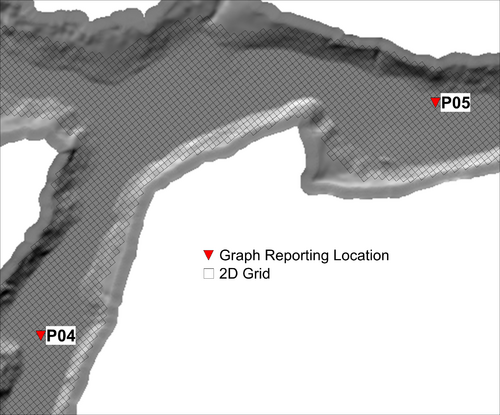
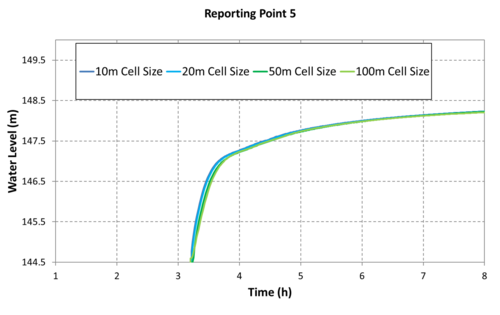
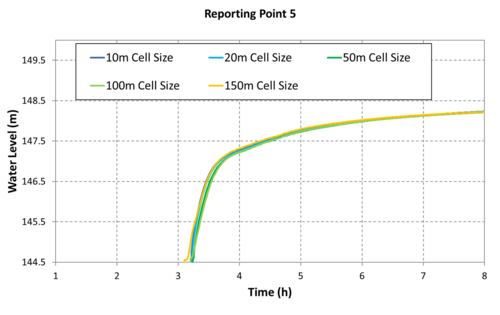
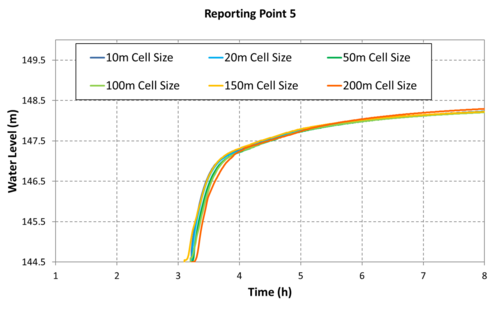
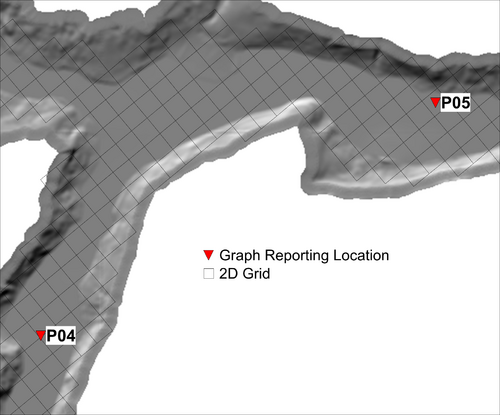
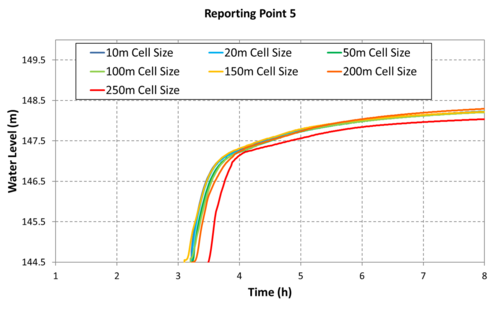
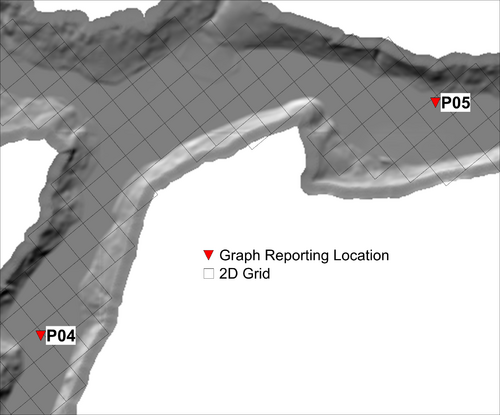
The EA benchmark testing original assumed a 50m cell resolution. For the purpose of this assessment a range of cell sizes from 10m to 300m have been used to determine the impact changing cell size has on the model result.
Test Case 1 - Results
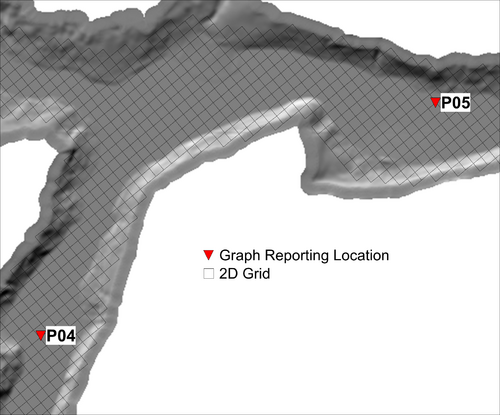
| Cell Size | Location 4 Result | Location 5 Result | Mesh Resolution Figure |
| 10m | 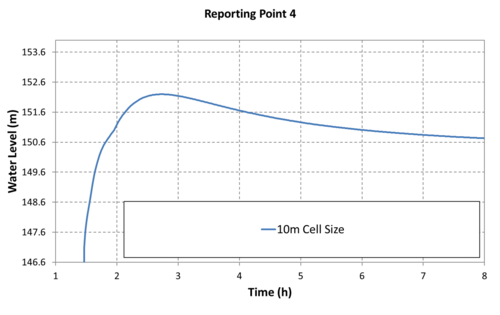 |
 |
|
| 20m | 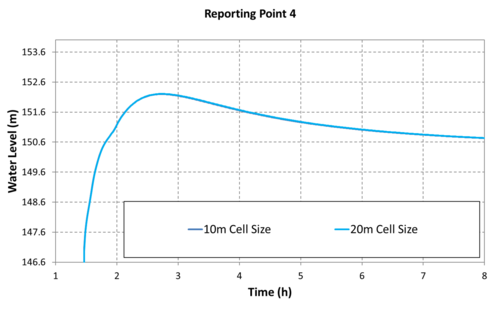 |
 |
|
| 50m | 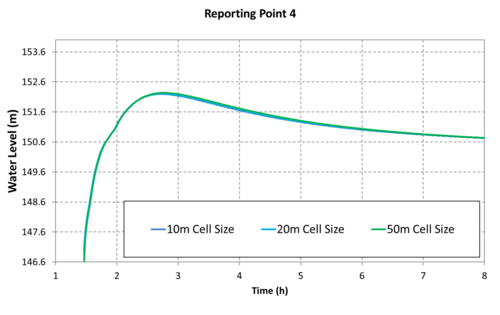 |
 |
|
| 100m | 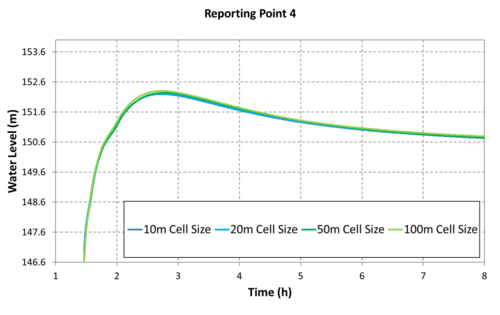 |
 |
|
| 150m | 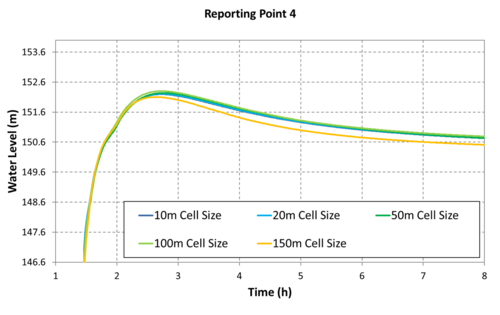 |
 |
|
| 200m | 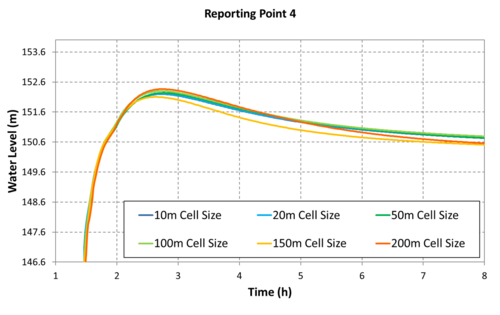 |
 |
|
| 250m | 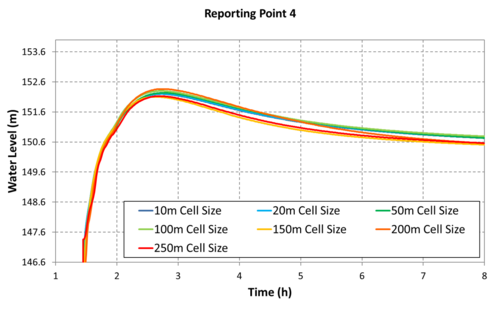 |
 |
|