Difference between revisions of "DOS GPU Usage"
Jump to navigation
Jump to search
Ellis Symons (talk | contribs) |
Ellis Symons (talk | contribs) |
||
| (5 intermediate revisions by the same user not shown) | |||
| Line 14: | Line 14: | ||
== What to do if GPU utilisation = 0% when running TUFLOW HPC (when using the GPU Module) == | == What to do if GPU utilisation = 0% when running TUFLOW HPC (when using the GPU Module) == | ||
| − | A common cause of 0% utilisation is if the calculations have accidentally been paused by activating 'Quick Edit' in the console. Quick edit mode was introduced in Windows 10 and is initiated if the curser clicks somewhere on the DOS window while a TUFLOW simulation is running. Quick Edit mode can be deactivated to avoid this issue. | + | A common cause of 0% utilisation is if the calculations have accidentally been paused by activating 'Quick Edit' mode in the console. Quick edit mode was introduced in Windows 10 (in Windows not TUFLOW) and is initiated if the curser clicks somewhere on the DOS window while a TUFLOW simulation is running. Quick Edit mode can be deactivated to avoid this issue. |
| − | < | + | * <b><u>[[DOS_Simulation_Paused | Disabling quick edit mode]]</u></b> |
| − | < | ||
| − | [[ | ||
| − | |||
| − | |||
| − | |||
| − | |||
| − | |||
| − | </ | ||
| − | Other troubleshooting | + | Other troubleshooting tips: |
* Ensure the simulation has entered the calculation loop and is not currently in the initialisation phase (which is performed on the CPU and not GPU) | * Ensure the simulation has entered the calculation loop and is not currently in the initialisation phase (which is performed on the CPU and not GPU) | ||
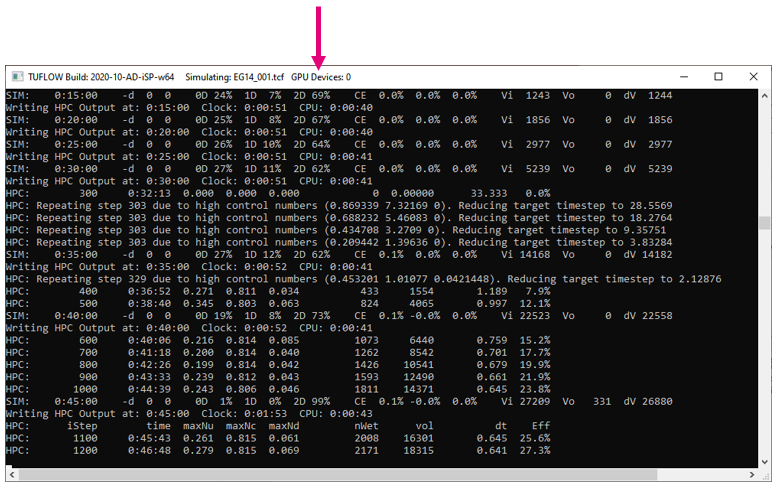
| − | * Check TUFLOW is running on a GPU device by checking the console title includes the <b>GPU Devices | + | * Check TUFLOW is running on a GPU device by checking the console title includes the <b>GPU Devices</b> text. If this text is not included, then the command "<tt>Hardware == GPU</tt>" was most likely not found in the TCF |
: [[File: GPU_devices_console.PNG]] | : [[File: GPU_devices_console.PNG]] | ||
Revision as of 19:08, 28 September 2022
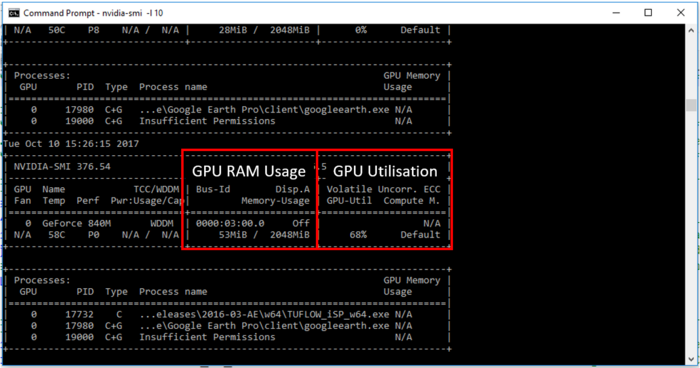
Nvidia-smi (also NVSMI) provides monitoring and management capabilities for each of NVIDIA's Tesla, Quadro, GRID and GeForce GPU device from Fermi and higher architecture families. The following steps can be used to access nVidia-smi and review real-time GPU usage statistics for TUFLOW simulations:
Accessing nvidia-smi to review GPU Usage
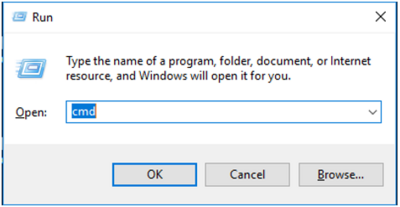
- Launch the DOS Command Prompt from the Run window (press Win+R on your keyboard to open "run" then type cmd).
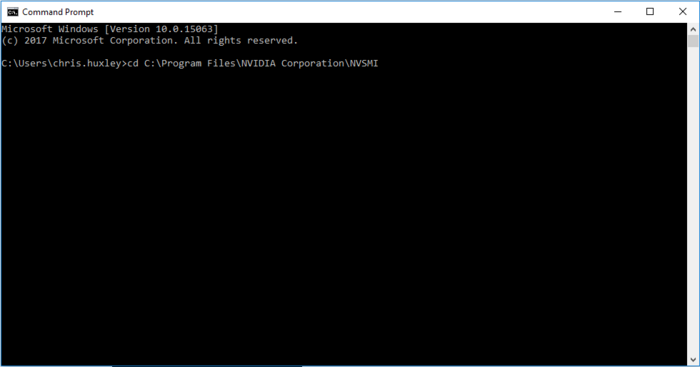
- Change the directory location to the folder where nvidia-smi is located. Type cd C:\Program Files\NVIDIA Corporation\NVSMI into the DOS window and press enter.
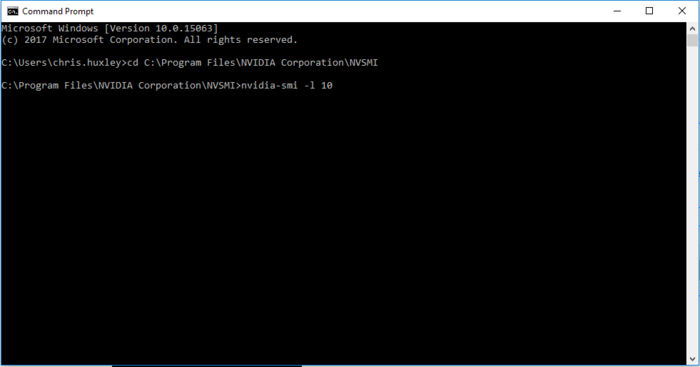
- Type nvidia-smi -l 10 in the DOS window and press enter. This will instruct nvidia-smi to refresh every 10 seconds.
- Review the nvidia-smi usage summary.
What to do if GPU utilisation = 0% when running TUFLOW HPC (when using the GPU Module)
A common cause of 0% utilisation is if the calculations have accidentally been paused by activating 'Quick Edit' mode in the console. Quick edit mode was introduced in Windows 10 (in Windows not TUFLOW) and is initiated if the curser clicks somewhere on the DOS window while a TUFLOW simulation is running. Quick Edit mode can be deactivated to avoid this issue.
Other troubleshooting tips:
- Ensure the simulation has entered the calculation loop and is not currently in the initialisation phase (which is performed on the CPU and not GPU)
- Check TUFLOW is running on a GPU device by checking the console title includes the GPU Devices text. If this text is not included, then the command "Hardware == GPU" was most likely not found in the TCF
