View Results in QGIS with Crayfish: Difference between revisions
Jump to navigation
Jump to search
Content deleted Content added
No edit summary |
No edit summary |
||
| (5 intermediate revisions by 3 users not shown) | |||
| Line 1: | Line 1: | ||
=Introduction= |
=Introduction= |
||
A plugin for QGIS has been developed (by Lutra Consulting) which allows the TUFLOW binary format (.dat) results to be viewed in QGIS without the need to convert these into shapefile or raster format. Installation instruction are available on the [http://www.lutraconsulting.co.uk/ |
A plugin for QGIS has been developed (by Lutra Consulting) which allows the TUFLOW binary format (.dat or .xmdf) results to be viewed in QGIS without the need to convert these into shapefile or raster format. Installation instruction are available on the [http://www.lutraconsulting.co.uk/products/crayfish/wiki Crayfish page on the Lutra website]. |
||
The plugin has a number of limitations as outlined on the page above, including support for 2D only model results (no 1D mapping). |
|||
To view models with 1D WLL mapping (which is introduced in Module 04) raster and vector layers will need to be used, this method is outlined in the following page <u>[[View_Results_in_QGIS | view Results in QGIS using shapefiles / raster layers]]</u>. |
|||
=Method= |
=Method= |
||
<ol> |
<ol> |
||
<li>Ensure that the Crayfish plugin has been installed ([http://www.lutraconsulting.co.uk/ |
<li>Ensure that the Crayfish plugin has been installed ([http://www.lutraconsulting.co.uk/products/crayfish/wiki installation instructions are on the Crayfish homepage]).</li> |
||
<li>Ensure QGIS is open.</li> |
<li>Ensure QGIS is open.</li> |
||
<li>Open a TUFLOW layer by selecting '''Plugins >> Crayfish >> Add Crayfish Layer''' from the menu</li> |
<li>Open a TUFLOW layer by selecting '''Plugins >> Crayfish >> Add Crayfish Layer''' from the menu</li> |
||
| Line 29: | Line 26: | ||
<li>Please feel free to experiment with the visualisation options and get a feel for your TUFLOW results. Do the results look sensible? What happens at the road crossings? |
<li>Please feel free to experiment with the visualisation options and get a feel for your TUFLOW results. Do the results look sensible? What happens at the road crossings? |
||
</ol> |
</ol> |
||
=Conclusion= |
=Conclusion= |
||
We have covered the basics of viewing 2D TUFLOW results in QGIS. Please return to the tutorial model, module 1. In the next step we review the performance of the TUFLOW model (warnings, checks and mass balance), to return please click <u>[[ |
We have covered the basics of viewing 2D TUFLOW results in QGIS. Please return to the tutorial model, module 1. In the next step we review the performance of the TUFLOW model (warnings, checks and mass balance), to return please click <u>[[Tutorial_Module01_Archive#Reviewing_Model_Performance | here]]</u> |
||
Latest revision as of 12:52, 9 January 2023
Introduction
A plugin for QGIS has been developed (by Lutra Consulting) which allows the TUFLOW binary format (.dat or .xmdf) results to be viewed in QGIS without the need to convert these into shapefile or raster format. Installation instruction are available on the Crayfish page on the Lutra website.
Method
- Ensure that the Crayfish plugin has been installed (installation instructions are on the Crayfish homepage).
- Ensure QGIS is open.
- Open a TUFLOW layer by selecting Plugins >> Crayfish >> Add Crayfish Layer from the menu
- In the dialogue navigate to the TUFLOW\results\M01\2d\ Folder and add the M01_5m_002_d.dat file (_d is depth).
- Repeat the process for the following files:
- M01_5m_002_h.dat (Head)
- M01_5m_002_V.dat (Velocity)
- M01_5m_002_q.dat (Flow)
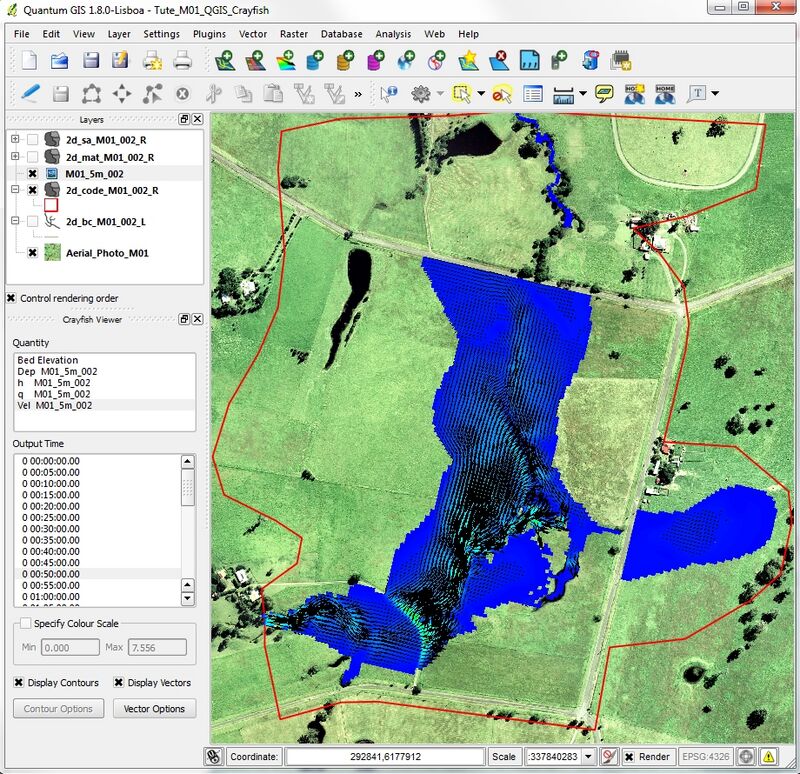
- A "Crayfish Viewer" dock should have been created when you opened the first results file. This contains option for choosing which parameter (depth, level, flow or velocity) to display and also the model output time. Select "Dep M01_5m_002" from the Quantity list and then scroll through the output times. The results should update as new output times are selected. The window should look similar the below:
- Both the depth and water level (head) are scalar results. Switch across to the "Vel M01_5m_002" dataset, this is a vector output and has both direction and magnitude. The "Display Contour" and "Display Vectors" options should now be selectable. Scrolling through the output times should display both shading (velocity magnitude) and arrows (direction).
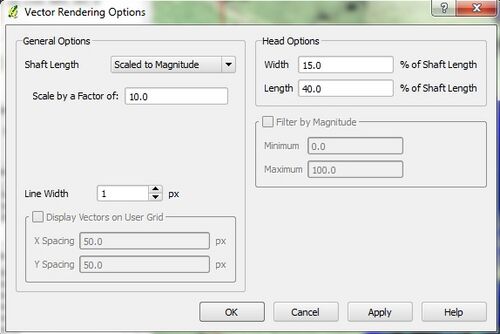
- The appearance of the contour and vectors can be changed. Open the Vector Options and change the "Shaft Length" option to Scale to Magnitude. Select apply to update the display. The arrow length is now proportional to the speed of the water.
- Please feel free to experiment with the visualisation options and get a feel for your TUFLOW results. Do the results look sensible? What happens at the road crossings?


Conclusion
We have covered the basics of viewing 2D TUFLOW results in QGIS. Please return to the tutorial model, module 1. In the next step we review the performance of the TUFLOW model (warnings, checks and mass balance), to return please click here