Difference between revisions of "View Results in SAGA"
| (7 intermediate revisions by 2 users not shown) | |||
| Line 1: | Line 1: | ||
| − | + | ||
==Introduction== | ==Introduction== | ||
In this section we will look at post-processing the TUFLOW results so they can be imported and viewed in SAGA. We will bring 3D surfaces (as gridded datasets) as well as point and vector data (as region objects). | In this section we will look at post-processing the TUFLOW results so they can be imported and viewed in SAGA. We will bring 3D surfaces (as gridded datasets) as well as point and vector data (as region objects). | ||
==TUFLOW to GIS== | ==TUFLOW to GIS== | ||
| − | In order to bring the 2D results written by TUFLOW (for example a water level surface) into | + | In order to bring the 2D results written by TUFLOW (for example a water level surface) into SAGA it is necessary to utilise a TUFLOW utility called '''TUFLOW_to_GIS.exe''' this utility can be downloaded from the TUFLOW website [http://www.tuflow.com/Tuflow%20Utilities.aspx (TUFLOW Downloads)]. |
There is separate wiki page on how to use the TUFLOW_to_GIS utility. This page can be found here [[TUFLOW_to_GIS|TUFLOW to GIS]]. | There is separate wiki page on how to use the TUFLOW_to_GIS utility. This page can be found here [[TUFLOW_to_GIS|TUFLOW to GIS]]. | ||
| − | + | <ol> | |
<li> Download the TUFLOW_to_GIS utility and unzip. Take note of where this utility is located.</li> | <li> Download the TUFLOW_to_GIS utility and unzip. Take note of where this utility is located.</li> | ||
<li> Create an empty text file in the '''TUFLOW\results\M01\2d\''' directory and name the file '''Process_Results.bat'''</li> | <li> Create an empty text file in the '''TUFLOW\results\M01\2d\''' directory and name the file '''Process_Results.bat'''</li> | ||
| Line 27: | Line 27: | ||
Pause <font color="grey">REM this keeps the Command Window open after processing</font> | Pause <font color="grey">REM this keeps the Command Window open after processing</font> | ||
</tt></li> | </tt></li> | ||
| + | ''Update the path to TUFLOW_to_GIS.exe if necessary.'' | ||
<li>In Windows Explorer navigate to the '''TUFLOW\results\M01\2d\''' directory and double click on the newly created batch file '''Process_Results.bat'''.</li> | <li>In Windows Explorer navigate to the '''TUFLOW\results\M01\2d\''' directory and double click on the newly created batch file '''Process_Results.bat'''.</li> | ||
| Line 38: | Line 39: | ||
[[File:T2G M01 OutputsArc.png|frame|none]] | [[File:T2G M01 OutputsArc.png|frame|none]] | ||
| − | + | </ol> | |
==Import to SAGA== | ==Import to SAGA== | ||
We will import the gridded surfaces to SAGA: | We will import the gridded surfaces to SAGA: | ||
| + | <ol> | ||
<li>In the ''Modules Library'' expand the ''Import/Export - Grids'' item and select ''Import ESRI Arc/Info Grid''. To execute the module, either double click on this item or select the ''Execute'' button in the ''Object Properties'' Window.</li> | <li>In the ''Modules Library'' expand the ''Import/Export - Grids'' item and select ''Import ESRI Arc/Info Grid''. To execute the module, either double click on this item or select the ''Execute'' button in the ''Object Properties'' Window.</li> | ||
[[File:Tute M01 Res Grids Saga1.png|frame|none]] | [[File:Tute M01 Res Grids Saga1.png|frame|none]] | ||
| Line 56: | Line 58: | ||
<li>To view the other timesteps that were converted (at times 2 and 3 hours) repeat the above steps.</li> | <li>To view the other timesteps that were converted (at times 2 and 3 hours) repeat the above steps.</li> | ||
<li>We will next look at the maximum water level results. In the data window double click on the '''M01_5m_002_d_g002.50_Max''' (or right click and select show) and create a new map window.</li> | <li>We will next look at the maximum water level results. In the data window double click on the '''M01_5m_002_d_g002.50_Max''' (or right click and select show) and create a new map window.</li> | ||
| − | + | </ol> | |
| − | |||
==Conclusion== | ==Conclusion== | ||
| − | We have covered the basics of viewing 2D TUFLOW results in SAGA. Please return to the tutorial model, module 1. In the next step we review the performance of the TUFLOW model (warnings, checks and mass balance), to return please click <u>[[ | + | We have covered the basics of viewing 2D TUFLOW results in SAGA. Please return to the tutorial model, module 1. In the next step we review the performance of the TUFLOW model (warnings, checks and mass balance), to return please click <u>[[Tutorial_Module01_Archive#Reviewing_Model_Performance | here]]</u> |
| − | |||
Latest revision as of 12:54, 9 January 2023
Introduction
In this section we will look at post-processing the TUFLOW results so they can be imported and viewed in SAGA. We will bring 3D surfaces (as gridded datasets) as well as point and vector data (as region objects).
TUFLOW to GIS
In order to bring the 2D results written by TUFLOW (for example a water level surface) into SAGA it is necessary to utilise a TUFLOW utility called TUFLOW_to_GIS.exe this utility can be downloaded from the TUFLOW website (TUFLOW Downloads).
There is separate wiki page on how to use the TUFLOW_to_GIS utility. This page can be found here TUFLOW to GIS.
- Download the TUFLOW_to_GIS utility and unzip. Take note of where this utility is located.
- Create an empty text file in the TUFLOW\results\M01\2d\ directory and name the file Process_Results.bat
- Open the text file in a text editor
- Add the following lines to the Process_Results.bat (these can be copied and pasted from below) and then save the batch file:
REM Any text following "REM" is treated as a remark or comment.
REM Process the maximums for water level, depth and velocity.
C:\TUFLOW\Utilities\TUFLOW_to_GIS.exe -b -asc -max M01_5m_002_h.dat
C:\TUFLOW\Utilities\TUFLOW_to_GIS.exe -b -asc -max M01_5m_002_V.dat
C:\TUFLOW\Utilities\TUFLOW_to_GIS.exe -b -asc -max M01_5m_002_d.dat
REM Process the depths at times 1, 2 and 3 hours.
C:\TUFLOW\Utilities\TUFLOW_to_GIS.exe -b -asc -t1 M01_5m_002_d.dat
C:\TUFLOW\Utilities\TUFLOW_to_GIS.exe -b -asc -t2 M01_5m_002_d.dat
C:\TUFLOW\Utilities\TUFLOW_to_GIS.exe -b -asc -t3 M01_5m_002_d.dat
REM Process the velocity vectors at times 1, 2 and 3 hours.
C:\TUFLOW\Utilities\TUFLOW_to_GIS.exe -b -shp -vector -t1 M01_5m_002_V.dat
C:\TUFLOW\Utilities\TUFLOW_to_GIS.exe -b -shp -vector -t2 M01_5m_002_V.dat
C:\TUFLOW\Utilities\TUFLOW_to_GIS.exe -b -shp -vector -t3 M01_5m_002_V.dat
Pause REM this keeps the Command Window open after processing
Update the path to TUFLOW_to_GIS.exe if necessary.
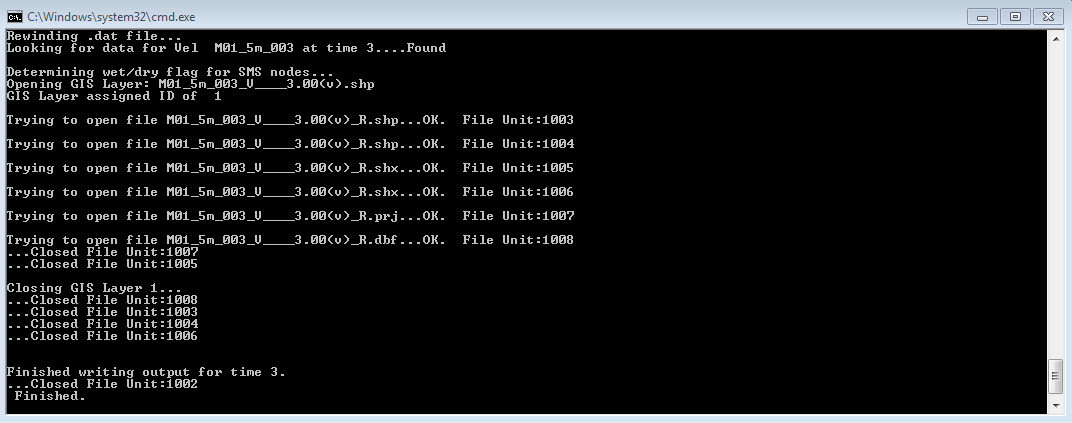
- In Windows Explorer navigate to the TUFLOW\results\M01\2d\ directory and double click on the newly created batch file Process_Results.bat. A console window should appear and the batch file may process for a minute or so. When finished the output screen should look like screen image below:
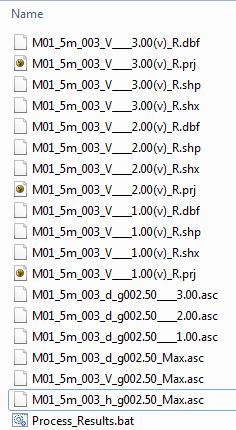
In windows explorer there should be 18 new files created, 6 .asc files and 12 files (3 conversions with 4 file created) for each of the vector sets.
TIP: If there are not 18 files created remove the -b switches from the batch file and re-run the batch file. The TUFLOW_to_GIS utility will prompt for an input after each command line. This can be useful in determining why the process has stopped.
Import to SAGA
We will import the gridded surfaces to SAGA:
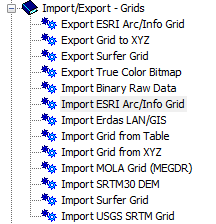
- In the Modules Library expand the Import/Export - Grids item and select Import ESRI Arc/Info Grid. To execute the module, either double click on this item or select the Execute button in the Object Properties Window.
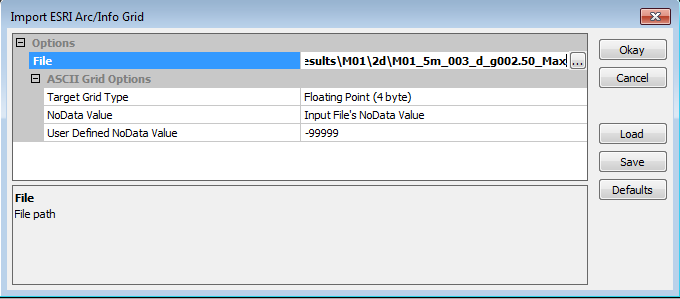
- In the dialogue, select one of the newly created .asc files.
- The above to steps need to be repeated for each of the 6 grids created above.
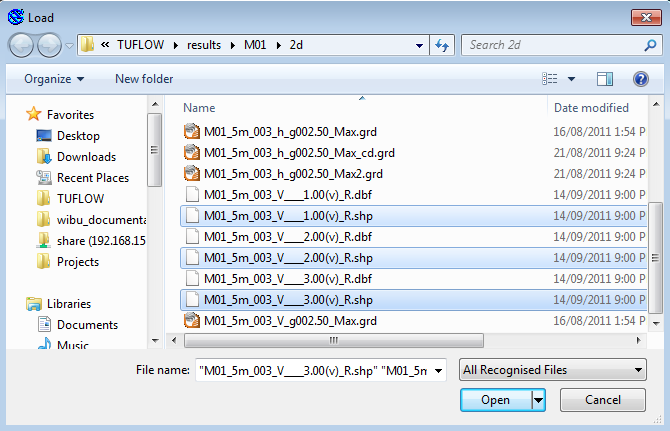
- The vector files can simply be opened using the Load dialogue in SAGA. Open the M01_5m_002_V____1.00(v)_R.shp, M01_5m_002_V____2.00(v)_R.shp and M01_5m_002_V____3.00(v)_R.shp files. Tip: Multiple files can be opened at the same time using the shift and/or control keys. Only the .shp extensions need to be loaded, the remainder are automatically opened.
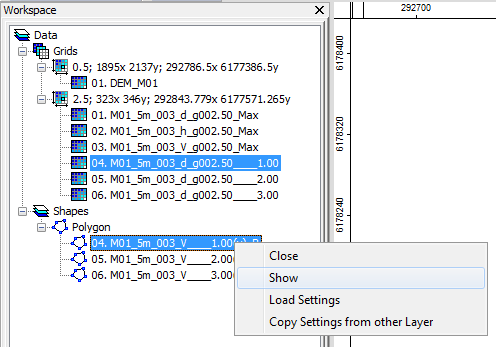
- In the Data tab of the Workspace Window, select the M01_5m_002_d_g002.50____1.00 and the M01_5m_002_V____1.00(v)_R items, right click on one of these and select Show. When prompted, select add layer to New Map
- To view the other timesteps that were converted (at times 2 and 3 hours) repeat the above steps.
- We will next look at the maximum water level results. In the data window double click on the M01_5m_002_d_g002.50_Max (or right click and select show) and create a new map window.
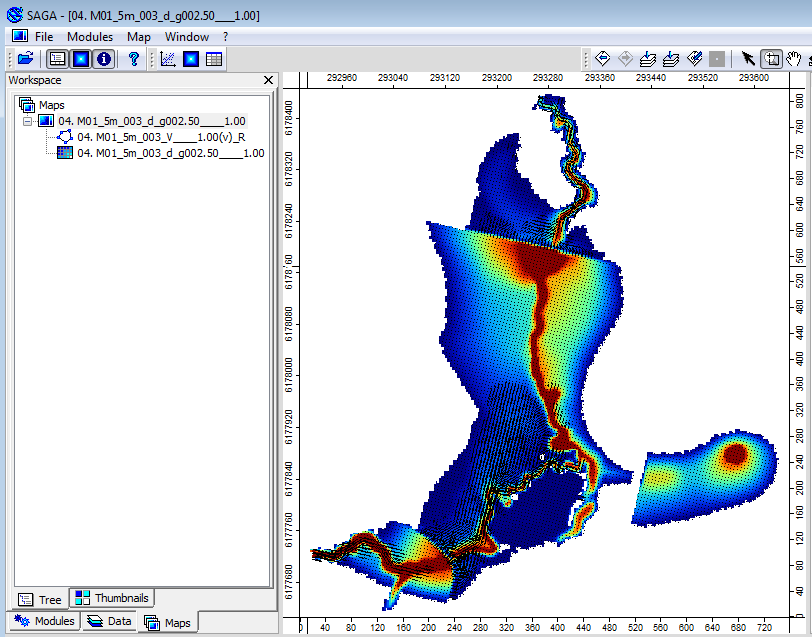
This will create a new map with the depth grid at time 1 hour (M01_5m_002_d_g002.50____1.00) and the velocity vectors at time 1 hour (M01_5m_002_V____1.00(v)_R). The map window should now look something like the image below:
Conclusion
We have covered the basics of viewing 2D TUFLOW results in SAGA. Please return to the tutorial model, module 1. In the next step we review the performance of the TUFLOW model (warnings, checks and mass balance), to return please click here
