TUFLOW SWMM Tutorial M02 Results QGIS: Difference between revisions
Jump to navigation
Jump to search
Content deleted Content added
Chris Huxley (talk | contribs) Created page with "==QGIS Result Viewing== <ol> <li>Open TUFLOW Viewer from the TUFLOW Plugin toolbar.<br> <br> File:tuflow_plugin_tuflow_viewer.png<br> <br> <li>Open the simulation results...." |
Chris Huxley (talk | contribs) No edit summary |
||
| (27 intermediate revisions by 3 users not shown) | |||
| Line 5: | Line 5: | ||
[[File:tuflow_plugin_tuflow_viewer.png]]<br> |
[[File:tuflow_plugin_tuflow_viewer.png]]<br> |
||
<br> |
<br> |
||
<li>Open the simulation results. |
<li>Open the simulation results: Select File > Load Results. Navigate to the '''TUFLOW\runs''' folder and select '''TS02_5m_001.tcf'''. |
||
| ⚫ | |||
:* Open 1D and 2D results: Select File > 'Load Results'. Navigate to the '''TUFLOW\runs''' folder and select '''TS02_5m_001.tcf'''. |
|||
| ⚫ | |||
:* Open 1D (no 2D results): Select File > 'Load Results - Time Series'. Navigate to the '''TUFLOW\results''' folder and select '''TS02_5m_001_swmm_ts.gpkg'''. |
|||
| ⚫ | |||
| ⚫ | |||
:*'''TS02_5m_001_swmm_ts_L''': 1D SWMM conduit flow results |
:*'''TS02_5m_001_swmm_ts_L''': 1D SWMM conduit flow results |
||
:*'''TS02_5m_001_PLOT_P''': 1D ESTRY and 2D plot output water level and velocity results ('''Note:''' There are no ESTRY results from this simulation) |
:*'''TS02_5m_001_PLOT_P''': 1D ESTRY and 2D plot output water level and velocity results ('''Note:''' There are no ESTRY results from this simulation) |
||
:*'''TS02_5m_001_PLOT_L''': 1D ESTRY and 2D plot output flow results ('''Note:''' There are no ESTRY results from this simulation) |
:*'''TS02_5m_001_PLOT_L''': 1D ESTRY and 2D plot output flow results ('''Note:''' There are no ESTRY results from this simulation) |
||
:*'''TS02_5m_001''': 2D TUFLOW |
:*'''TS02_5m_001''': 2D TUFLOW results |
||
<br> |
<br> |
||
{{Video|name= |
{{Video|name=Animation_TS2_Results_01e.mp4|width=1350}} |
||
| ⚫ | |||
<li>In the QGIS Layers Panel, select (left click) '''TS02_5m_001''' to establish it as the active dataset. Click on a scalar dataset 'Depth' under the Result Type in the TUFLOW Viewer 'Map Outputs' list. Move the time slider to observe how the results vary at different times during the simulation.<br> |
|||
</ol> |
|||
'''Note:''' The styling of the Map Outputs can be changed by right clicking on each result dataset and editing the 'Properties'. |
|||
| ⚫ | |||
==Pipe Flow Results== |
|||
| ⚫ | |||
<li>In the TUFLOW Viewer Panel, set the time to '00:05:00.00'. |
|||
<ol> |
|||
<li>In the QGIS Layers Panel, right click '''TS02_5m_001_swmm_ts_L''' and select 'Zoom to Layer(s)'. |
<li>In the QGIS Layers Panel, right click '''TS02_5m_001_swmm_ts_L''' and select 'Zoom to Layer(s)'. |
||
<li>In the TUFLOW Viewer Panel, click 'Play Through Timesteps' [[File: Play_through_timesteps_icon.png]]. Observe how the '''TS02_5m_001_swmm_ts_L''' results change color depending on the amount of flow within the 1D pipes. |
|||
<li>Right click '''TS02_5m_001_swmm_ts_L''' again, and select 'Show Labels'. |
|||
| ⚫ | |||
| ⚫ | |||
<li>Tick on 'Show Current Time'. |
|||
<br><br> |
<br><br> |
||
{{Video|name= |
{{Video|name=Animation_TS2_Results_02e.mp4|width=1350}} |
||
<br> |
|||
<li>In the QGIS Layers Panel, select (left click) '''TS02_5m_001_swmm_ts_L'''. |
|||
| ⚫ | |||
| ⚫ | |||
<li>Use the 'Select Features' tool to highlight other pipes within the network (hold Shift to select multiple). |
|||
<br><br> |
|||
| ⚫ | |||
<br> |
|||
<li>In the QGIS Layers Panel, select (left click) '''TS02_5m_001_swmm_ts_P'''. |
|||
<li>Use the 'Select Features' tool to highlight a node junction within the network. |
|||
<li>Click on the 'Water Level' dataset under 'Result Type' in the TUFLOW Viewer 'Time Series' list. |
|||
<li>Use the 'Select Features' tool to highlight other node junctions within the network (hold Shift to select multiple). |
|||
<br><br> |
|||
{{Video|name=Animation_TS2_Results_04e.mp4|width=1350}} |
|||
<br> |
|||
</ol> |
</ol> |
||
| ⚫ | |||
<ol> |
|||
<li>In the QGIS Layers Panel, select (left click) '''TS02_5m_001_swmm_ts_L'''. |
|||
<li>Use the 'Select Features' tool to highlight two pipe segments. The long-section between the pipes will be plotted. |
|||
| ⚫ | |||
<li>Click on the 'Cross Section / Long Profile' tab. |
|||
<li>Click on the 'Water level', 'Max Water Level' and 'Culverts and Pipes' datasets under 'Result Type' in the TUFLOW Viewer 'Time Series' list. |
|||
<li>Move the time slider to view how the water level in the pipe varies during the simulation. |
|||
<br><br> |
|||
{{Video|name=Animation_TS2_Results_05e.mp4|width=1350}} |
|||
<br> |
|||
</ol> |
|||
<br> |
|||
{{Tips Navigation |
{{Tips Navigation |
||
|uplink=[[TUFLOW_SWMM_Tutorial_M02#Check_Files_and_Results_Output| Back to TUFLOW SWMM Tutorial 2]] |
|uplink=[[TUFLOW_SWMM_Tutorial_M02#Check_Files_and_Results_Output| Back to TUFLOW SWMM Tutorial 2]] |
||
Latest revision as of 16:31, 20 May 2024
QGIS Result Viewing
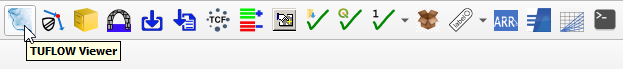
- Open TUFLOW Viewer from the TUFLOW Plugin toolbar.
- Open the simulation results: Select File > Load Results. Navigate to the TUFLOW\runs folder and select TS02_5m_001.tcf.
- When asked 'Do you want to open result GIS Layer?', select 'Yes'. Five new files will load to the QGIS Layers Panel:
- TS02_5m_001_swmm_ts_P: 1D SWMM node junction and outlet water level results
- TS02_5m_001_swmm_ts_L: 1D SWMM conduit flow results
- TS02_5m_001_PLOT_P: 1D ESTRY and 2D plot output water level and velocity results (Note: There are no ESTRY results from this simulation)
- TS02_5m_001_PLOT_L: 1D ESTRY and 2D plot output flow results (Note: There are no ESTRY results from this simulation)
- TS02_5m_001: 2D TUFLOW results

Pipe Flow Results
- In the QGIS Layers Panel, right click TS02_5m_001_swmm_ts_L and select 'Zoom to Layer(s)'.
- In the TUFLOW Viewer Panel, click 'Play Through Timesteps'
 . Observe how the TS02_5m_001_swmm_ts_L results change color depending on the amount of flow within the 1D pipes.
- In the QGIS Layers Panel, select (left click) TS02_5m_001_swmm_ts_L.
- Use the 'Select Features' tool to highlight a pipe within the network.
- Click on the 'Flow' dataset under 'Result Type' in the TUFLOW Viewer 'Time Series' list.
- Use the 'Select Features' tool to highlight other pipes within the network (hold Shift to select multiple).
- In the QGIS Layers Panel, select (left click) TS02_5m_001_swmm_ts_P.
- Use the 'Select Features' tool to highlight a node junction within the network.
- Click on the 'Water Level' dataset under 'Result Type' in the TUFLOW Viewer 'Time Series' list.
- Use the 'Select Features' tool to highlight other node junctions within the network (hold Shift to select multiple).
Pipe Long-section Results
- In the QGIS Layers Panel, select (left click) TS02_5m_001_swmm_ts_L.
- Use the 'Select Features' tool to highlight two pipe segments. The long-section between the pipes will be plotted.
- Click on the 'Cross Section / Long Profile' tab.
- Click on the 'Water level', 'Max Water Level' and 'Culverts and Pipes' datasets under 'Result Type' in the TUFLOW Viewer 'Time Series' list.
- Move the time slider to view how the water level in the pipe varies during the simulation.
| Up |
|---|