Difference between revisions of "TUFLOW CATCH Tutorial M02 Check Files QGIS"
Jump to navigation
Jump to search
| Line 12: | Line 12: | ||
<li> The _im_check_L layer shows where the interventions have been applied, and their lengths. Notice that the lines step around the grid cells. This occurs because interventions use a cell face based calculation to remove pollutants. This calculation looks at the flux going across every cell face that the line intercepts with.<br> | <li> The _im_check_L layer shows where the interventions have been applied, and their lengths. Notice that the lines step around the grid cells. This occurs because interventions use a cell face based calculation to remove pollutants. This calculation looks at the flux going across every cell face that the line intercepts with.<br> | ||
<br> | <br> | ||
| − | {{Video|name=}}<br> | + | {{Video|name=animation_TC2_check_01a.mp4|width=1236}}<br> |
</ol> | </ol> | ||
Revision as of 13:02, 27 May 2025
Page Under Construction
Introduction
QGIS is used to review the intervention devices.
Review the Interventions
- In Windows File Explorer, navigate to the TUFLOWCATCH\check folder and drag and drop TC02_001_catchment_hydraulic_im_check_L.shp and TC02_001_catchment_hydraulic_grd_check_R.shp into QGIS.
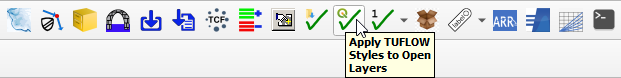
- Click on the 'Apply TUFLOW Styles to Open Layers' symbol from the TUFLOW Plugin toolbar. This will style the _grd_check_R layer. To make the _im_check_L clearer, right click the layer and select 'Properties...'. In the 'Symbology' tab, set 'Width' to 0.7mm.
- The _im_check_L layer shows where the interventions have been applied, and their lengths. Notice that the lines step around the grid cells. This occurs because interventions use a cell face based calculation to remove pollutants. This calculation looks at the flux going across every cell face that the line intercepts with.

| Up |
|---|