MI 1D Result Viewer: Difference between revisions
Jump to navigation
Jump to search
Content deleted Content added
Chris Huxley (talk | contribs) Created page with "The TUFLOW Productivity Utilities (miTools) use the _TS GIS layer to plot the 1D time-series results. The program can also be used to summarise the peaks and..." |
Chris Huxley (talk | contribs) No edit summary |
||
| (5 intermediate revisions by the same user not shown) | |||
| Line 1: | Line 1: | ||
The TUFLOW Productivity Utilities ([[miTools_Tips|miTools]]) use the _TS GIS layer to plot |
The TUFLOW Productivity Utilities ([[miTools_Tips|miTools]]) use the _TS GIS layer to plot 1D time-series results. Three examples are provided below. |
||
<ol> |
|||
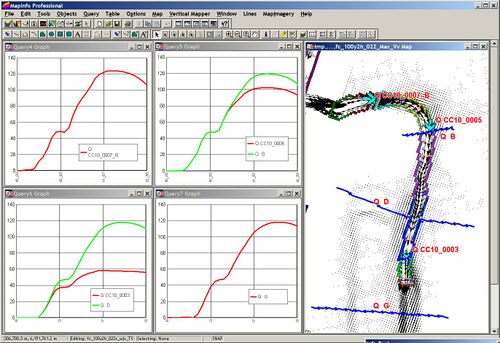
<li>The program can be used to summarise the peaks and time of peaks for all series within an active Graph Window.<br><br> |
|||
| ⚫ | |||
| ⚫ | |||
[[File:MI_1D_Viewer_002.jpg|500px]] <br><br> |
|||
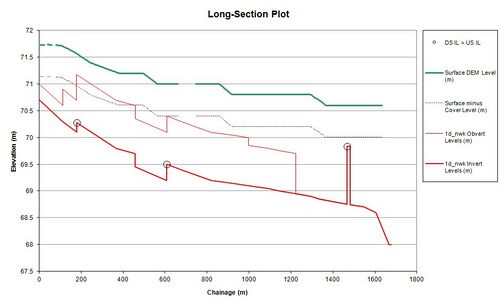
| ⚫ | <li>Long-section plots can be generated on a specified downstream reach of the 1d_nwk GIS layer. The tool will prompt the user for a DEM in which to extract a ground surface profile before plotting the long-section in Excel. This tool is particularly useful for viewing the results of a pipe network. <br> |
||
| ⚫ | |||
| ⚫ | |||
[[File: |
[[File:MI_1D_Viewer_003.jpg|500px]]<br> |
||
</ol> |
|||
| ⚫ | |||
[[File:MI_1D_Viewer_003.jpg|300px]] |
|||
Latest revision as of 07:58, 11 August 2015
The TUFLOW Productivity Utilities (miTools) use the _TS GIS layer to plot 1D time-series results. Three examples are provided below.
- The program can be used to summarise the peaks and time of peaks for all series within an active Graph Window.
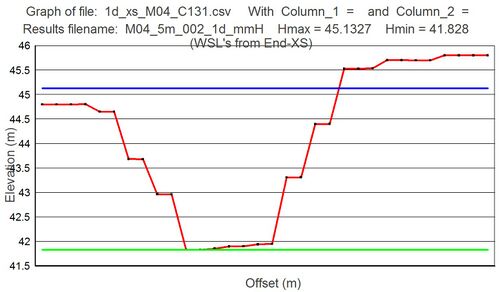
- The peak water level results within a _1d_mmH layer may be plotted along with the cross-sectional data:
- Long-section plots can be generated on a specified downstream reach of the 1d_nwk GIS layer. The tool will prompt the user for a DEM in which to extract a ground surface profile before plotting the long-section in Excel. This tool is particularly useful for viewing the results of a pipe network.