Difference between revisions of "TUFLOW Viewer - Using A Secondary Axis"
Ellis Symons (talk | contribs) (Created page with "===Tool Description=== ===Examples=== ===Links=== ====Similar Tools==== * Load Results * TUFLOW_Viewer_-_Load_Results_-_Map_Outputs | Load...") |
Ellis Symons (talk | contribs) |
||
| (8 intermediate revisions by 3 users not shown) | |||
| Line 1: | Line 1: | ||
===Tool Description=== | ===Tool Description=== | ||
| − | + | It is possible to use a secondary axis when plotting various results together. The secondary axis can be used for any plotting type (e.g. Map Outputs, Time Series, Hydraulic Properties, Time Series, Cross-Sections etc.). The one exception is curtain plotting, this will only ever be drawn on the primary axis. The vertical profile will use a secondary X axis, all other plotting types will use a secondary Y axis.<br> | |
| − | |||
| − | |||
| − | |||
| − | |||
| − | |||
| − | === | + | To use a secondary axis: |
| − | + | <ol> | |
| + | <li> In the '''Result Type''' widget, click the secondary axis icon [[File: 2nd_axis_2.png | 15px]] next to the result(s) type that should be placed on a secondary axis. An alternative approach is to right-click the result type and checking on '''Secondary Axis'''.<br> | ||
| + | [[File: Plotting_Secondary_Axis_Context_Menu.PNG]] | ||
| + | <li> Initiate the plot by the standard process, or by refreshing the plot [[File: refreshplotblack.png | 15px]] (the plot should automatically refresh when the secondary axis is activated). | ||
| + | <li> All instances of that result type should now be displayed on a secondary axis. | ||
| + | </ol> | ||
| + | |||
| + | To plot flux on the secondary axis, use the button next to the plot flux button:<br> | ||
| + | [[file: Plotting_Secondary_Axis_Flux.PNG]]<br> | ||
| + | |||
| + | Since v3.7.0.23 it is possible to switch the secondary axis type (i.e. switch between using a secondary y-axis and using a secondary x-axis). This can be done by right clicking the plot window and selecting 'Switch Secondary Axis'. This is particularly useful when plotting 1D hydraulic property tables along side their cross-sections as the y-axis is constant in this case.<br> | ||
| + | [[File: Plotting_changing_secondary_axis_type_example.png]]<Br> | ||
| + | |||
| + | ===Example=== | ||
| + | [[File: Plotting_Secondary_Axis_Example.gif]] | ||
| + | <br><br> | ||
| + | {{Tips Navigation | ||
| + | |uplink=[[TUFLOW_Viewer#General_Plot_Display_Options| Back to TUFLOW Viewer Main Page]] | ||
| + | }} | ||
Latest revision as of 21:16, 22 February 2023
Tool Description
It is possible to use a secondary axis when plotting various results together. The secondary axis can be used for any plotting type (e.g. Map Outputs, Time Series, Hydraulic Properties, Time Series, Cross-Sections etc.). The one exception is curtain plotting, this will only ever be drawn on the primary axis. The vertical profile will use a secondary X axis, all other plotting types will use a secondary Y axis.
To use a secondary axis:
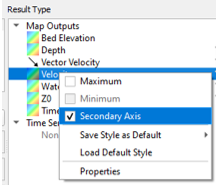
- In the Result Type widget, click the secondary axis icon
 next to the result(s) type that should be placed on a secondary axis. An alternative approach is to right-click the result type and checking on Secondary Axis.
- Initiate the plot by the standard process, or by refreshing the plot
 (the plot should automatically refresh when the secondary axis is activated).
- All instances of that result type should now be displayed on a secondary axis.

To plot flux on the secondary axis, use the button next to the plot flux button:

Since v3.7.0.23 it is possible to switch the secondary axis type (i.e. switch between using a secondary y-axis and using a secondary x-axis). This can be done by right clicking the plot window and selecting 'Switch Secondary Axis'. This is particularly useful when plotting 1D hydraulic property tables along side their cross-sections as the y-axis is constant in this case.

Example

| Up |
|---|