QGIS ARR to TUFLOW: Difference between revisions
| (37 intermediate revisions by 6 users not shown) | |||
| Line 1: | Line 1: | ||
The ARR to TUFLOW utility has been developed to help users set up a TUFLOW model that uses Australian Rainfall and Runoff (ARR) input parameters and the Australian Bureau of Meteorology (BOM) rainfall by automating the collection and processing of the data. The inputs and outputs of the tool are explained in detail below. '''''Note:''''' this tool helps with data processing, however is not a substitute to reading ARR. Similarly this wiki page discusses the use of the tool and the options, however context should be derived from ARR directly. Please see the [ |
The ARR to TUFLOW utility has been developed to help users set up a TUFLOW model that uses Australian Rainfall and Runoff (ARR) input parameters and the Australian Bureau of Meteorology (BOM) rainfall by automating the collection and processing of the data. The inputs and outputs of the tool are explained in detail below. '''''Note:''''' this tool helps with data processing, however is not a substitute to reading ARR. Similarly this wiki page discusses the use of the tool and the options, however context should be derived from ARR directly. Please see the [https://arr.ga.gov.au/arr-guideline ARR Website] for more information.<br> |
||
| ⚫ | |||
<br> |
<br> |
||
| ⚫ | |||
=Getting Started= |
=Getting Started= |
||
===Installation=== |
===Installation=== |
||
| Line 9: | Line 10: | ||
===QGIS Version=== |
===QGIS Version=== |
||
The ARR to TUFLOW tool is, for the most part |
The ARR to TUFLOW tool is, for the most part (see note below), a Python tool that runs independently of QGIS. Therefore the tool should not be sensitive to the installed QGIS version, however occasionally QGIS will update the Python version that is packaged with the installation which means there is a small risk that the tool will break between QGIS versions. If the tool does break, please see <u>[[#The_Tool_Isn.27t_Working | The Tool Isn't Working]]</u> for information (the solution is most likely to update the plugin rather than re-install an older version of QGIS). |
||
''Note:'' The tool does use QGIS for pre-processing tasks, such as area and centroid calculation as well as reprojection or cartesian to long-lat. |
''Note:'' The tool does use QGIS for pre-processing tasks, such as area and centroid calculation as well as reprojection or cartesian to long-lat. |
||
| Line 22: | Line 23: | ||
<li> Load a catchment GIS file (e.g. shp file) into QGIS - this can either be a polygon or point layer |
<li> Load a catchment GIS file (e.g. shp file) into QGIS - this can either be a polygon or point layer |
||
<li> Open the '''ARR to TUFLOW''' tool |
<li> Open the '''ARR to TUFLOW''' tool |
||
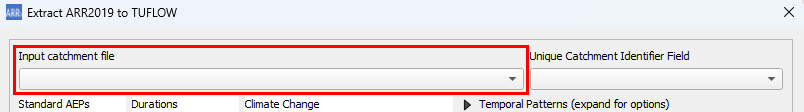
<li> Select the GIS catchment layer in '''Input Catchment File''' dropdown box<br> |
<li> Select the GIS catchment layer in '''Input Catchment File''' dropdown box.<br> |
||
[[File: ARR_dialog_input_catchment_file_01a.png]]<br> |
[[File: ARR_dialog_input_catchment_file_01a.png]]<br> |
||
| ⚫ | |||
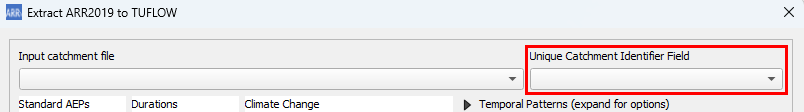
<li> Select the attribute field to use as the catchment name in the '''Unique Catchment Identifier Field''' dropdown<br> |
<li> Select the attribute field to use as the catchment name in the '''Unique Catchment Identifier Field''' dropdown.<br> |
||
[[File: ARR_dialog_unique_catchment_identifier_01a.png]]<br> |
[[File: ARR_dialog_unique_catchment_identifier_01a.png]]<br> |
||
<br> |
|||
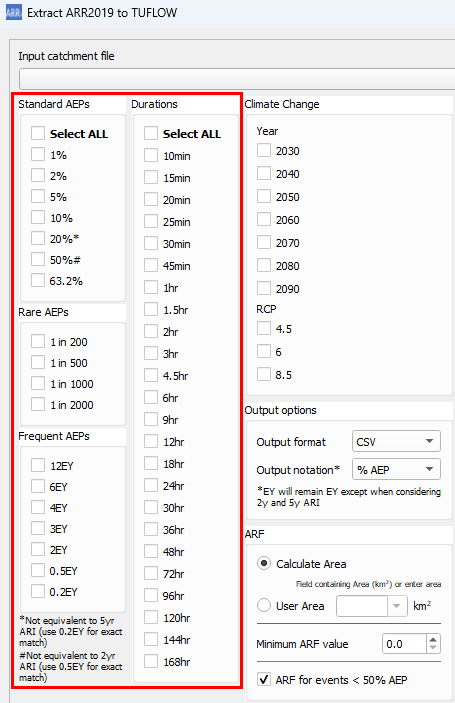
<li> Select storm event combinations from the list of magnitudes and durations<br> |
<li> Select storm event combinations from the list of magnitudes and durations.<br> |
||
[[File: ARR_dialog_storm_events_01a.png]]<br> |
[[File: ARR_dialog_storm_events_01a.png]]<br> |
||
<br> |
|||
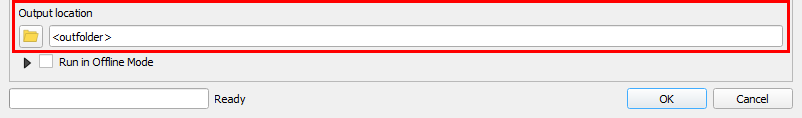
<li> Choose an output location<br> |
<li> Choose an output location.<br> |
||
[[File: ARR_dialog_output_location_01a.png]]<br> |
[[File: ARR_dialog_output_location_01a.png]]<br> |
||
<br> |
|||
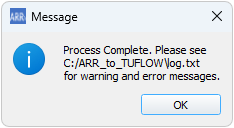
<li> Click '''OK''' and wait for the tool to finish<br> |
<li> Click '''OK''' and wait for the tool to finish.<br> |
||
[[File: ARR_tool_complete_dialog.PNG]] |
|||
[[File: ARR_tool_complete_dialog_01a.png]] |
|||
| ⚫ | |||
</ol> |
|||
| ⚫ | |||
=Output= |
=Output= |
||
| Line 70: | Line 76: | ||
===Example: Using the outputs in a TUFLOW model=== |
===Example: Using the outputs in a TUFLOW model=== |
||
* [[QGIS_ARR_to_TUFLOW_Example | Example use of the ARR to TUFLOW tool]] |
* <u>[[QGIS_ARR_to_TUFLOW_Example | Example use of the ARR to TUFLOW tool]]</u> |
||
<br> |
<br> |
||
=Additional Options= |
=Additional Options= |
||
===Climate Change=== |
===Climate Change=== |
||
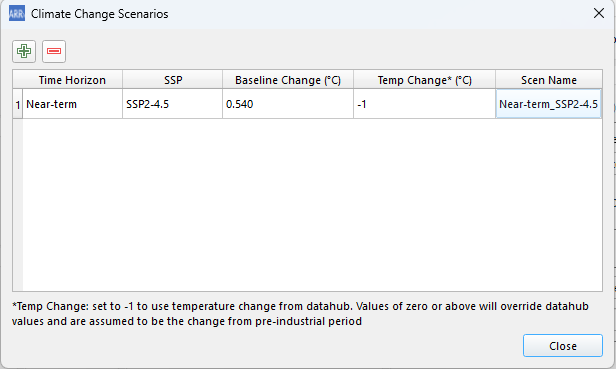
Climate change options can be added by clicking on '''Edit''' under the climate change section. This opens up a table widget that the user can then add/remove climate change scenarios based on the guidance in ARR v4.2. Once a user adds a scenario (green plus), they can double click on the values to change them. For example, double clicking on SSP2-4.5 under the 'SSP' heading will show the available Shared Socioeconomic Pathway (SSP) options. Scenarios added in the table will be displayed in the climate change section (underneath the edit button). Note: each scenario name must be unique and generally the table widget will force unique names. The scenario names will be used throughout the outputs and the user is free to customise the scenario names as they want.<br> |
|||
Climate change options can be added by checking on a combination of climate change years and Representative Concentration Pathways (RCP) in the dialog. Selecting at least one climate change scenario will output: |
|||
The table columns within the table widget are based on ARR guidelines v4.2 and the examples presented in Book 1, Chapter 6. Please note the following assumptions:<br> |
|||
* Near-term horizon = 2030 |
|||
* Medium-term horizon = 2050 |
|||
* Long-term horizon = 2090 |
|||
* Temperature Change - Setting this to -1 will adopt the temperature changes output in the climate change part of the ARR datahub download. If a value of zero or greater is set by the user, this will be adopted instead of the datahub values and it will be assumed that these are changes relative to the pre-industrial period. Note: the temperature change will be stopped from going negative within the calculation. |
|||
By adding climate change scenarios, the following outputs will be turned on: |
|||
* An extra boundary database file: '''bc_dbase_CC.csv''' |
* An extra boundary database file: '''bc_dbase_CC.csv''' |
||
* Climate change inflows will be appended to the end of each event's inflow file |
* Climate change inflows will be appended to the end of each event's inflow file |
||
* One additional event option will also be added to the event file for each combination of selected climate change scenarios labelled |
* One additional event option will also be added to the event file for each combination of selected climate change scenarios labelled based on the scenario name. It is intended that the climate change scenarios would be treated as a separate event (e1 = magnitude, e2 = duration, e3 = temporal pattern, e4 = climate change scenario) however the output files can easily be manipulated by the user to configure the model differently. |
||
* The following CSV files will be written to the '''data''' output folder: |
|||
[[File: ARR_dialog_climate_change.PNG | 500px]]<br><br> |
|||
** ''<scen_name>_rainfall_factors.csv'' |
|||
[[File: ARR_example_climate_change_rf_inflow.PNG | 650px]] <br><br> |
|||
** ''<scen_name>_rainfall_depths.csv'' |
|||
[[File: ARR_example_climate_change_tef.PNG | 300px]] |
|||
** ''<scen_name>_losses.csv''<br><br> |
|||
[[File: ARR_dialog_climate_change_01b.png]]<br><br> |
|||
[[File: ARR_example_climate_change_rf_inflow_01a.png|1200px]] <br><br> |
|||
[[File: ARR_example_climate_change_tef_01a.png]] |
|||
<br><br> |
<br><br> |
||
====LIMB Data and Climate Change==== |
|||
The LIMB sub-daily rainfall data midpoint is 2002, which differs from the ARR baseline period of 1990. Below is a worked example of applying a baseline change in the tool for the <b>Near term</b> and <b>SSP2-4.5</b> scenario. Note, this is not required for daily or longer rainfall durations. |
|||
Reference document:<br> |
|||
<b><u>https://data.arr-software.org/static/pdf/LIMB_Addendum_climate_change_considerations.pdf</u></b> |
|||
<ol> |
|||
<li> Calculate the difference in temperature, comparing the ARR values to the LIMB values: |
|||
<ol> |
|||
<li> From [https://www.arr-software.org/pdfs/ARR_190514_V4.2.pdf ARR v4.2] Book 1, Chapter 6, Table 1.6.2: Temperature change = <b>1.2</b> |
|||
<li> From the LIMB reference document above, Table 3: Temperature change = <b>0.66</b> |
|||
<li> Therefore, baseline temperature change = <b>0.54</b> |
|||
</ol> |
|||
<li> Update the "Baseline Change" value in the climate change dialog within the ARR to TUFLOW tool.<br> |
|||
[[File:Climate_change_scenario_dialog_limb_baseline_change.png]] |
|||
<li> Run the tool and check that the climate change uplift factors match the values referenced in the [https://data.arr-software.org/static/pdf/LIMB_Addendum_climate_change_considerations.pdf LIMB reference document Appendix A tables]. |
|||
</ol> |
|||
===Temporal Patterns=== |
===Temporal Patterns=== |
||
Temporal pattern options can be found by expanding the '''Temporal Patterns''' section in the dialog. |
Temporal pattern options can be found by expanding the '''Temporal Patterns''' section in the dialog. |
||
* '''Manually Specify Point Temporal Patterns (csv)''' - lets the user specify the point temporal patterns which is expected to be in the ARR datahub format |
* '''Manually Specify Point Temporal Patterns (csv)''' - lets the user specify the point temporal patterns which is expected to be in the ARR datahub format |
||
* '''Manually Specify Areal Temporal Patterns (csv)''' - lets the user specify the arealtemporal patterns which is expected to be in the ARR datahub format |
* '''Manually Specify Areal Temporal Patterns (csv)''' - lets the user specify the arealtemporal patterns which is expected to be in the ARR datahub format |
||
* '''Optional Additional Temporal Patterns''' - |
* '''Optional Additional Temporal Patterns''' - Lets the user add additional temporal patterns in a couple of different ways:<br> |
||
** The user can choose to add temporal patterns from other temporal pattern regions. This is only if the user wishes to included ''additional'' temporal patterns. The temporal patterns from the catchment location (taken at the catchment centroid) will always be included. The additional temporal patterns will be included in the inflow files and added to the event file. |
|||
[[File: ARR_Dialog_temporal_patterns.PNG | 300px]]<br><br> |
|||
** The user can choose to add temporal patterns from other temporal pattern bins within the same region. For point temporal patterns, this would add temporal patterns from the 'frequent', 'intermediate', and 'rare' bins. For areal temporal patterns, this would add temporal patterns from other "Area" bins. The "correct" bin will always make up the first 10 temporal patterns (TP01 to TP10). |
|||
[[File: ARR_example_additional_temporal_patterns_rf_inflow.PNG | 650px]]<Br><br> |
|||
*** For Areal temporal patterns - The user has the additional option to choose how many additional areal temporal pattern sets to add. The default is 2 as this matches the number of additional point temporal patterns that would be added (but it doesn't necessarily have to be the same). The "Area" bins chosen will be the next closest in order. |
|||
[[File: ARR_example_additional_temporal_patterns_tef.PNG | 250px]] |
|||
[[File: ARR_Dialog_temporal_patterns_01a.png]]<br><br> |
|||
| ⚫ | |||
[[File: ARR_example_additional_temporal_patterns_rf_inflow_01a.png]]<Br><br> |
|||
[[File: ARR_example_additional_temporal_patterns_tef_01a.png]]<br><br> |
|||
===Rainfall=== |
===Rainfall=== |
||
<b><u>[https://data.arr-software.org/limb_specific LIMB Rainfall Data]</u></b><br> |
<b><u>[https://data.arr-software.org/limb_specific LIMB Rainfall Data]</u></b><br> |
||
| Line 101: | Line 143: | ||
<br> |
<br> |
||
If the user has selected AEP or durations outside of the provided LIMB data range, the tool will use BOM 2016 rainfall data. If the user has selected AEP or durations within the LIMB data range, but the value is not part of the provided IFD, the tool will interpolate the rainfall depth from the provided LIMB data.<br> |
If the user has selected AEP or durations outside of the provided LIMB data range, the tool will use BOM 2016 rainfall data. If the user has selected AEP or durations within the LIMB data range, but the value is not part of the provided IFD, the tool will interpolate the rainfall depth from the provided LIMB data.<br> |
||
[[File: |
[[File: arr2016_limb_selector_01a.png]]<br><br> |
||
===Rainfall Losses=== |
===Rainfall Losses=== |
||
The following sections summarise the available loss options. Please note, as recommended in ARR2019, <u>[https://data.arr-software.org/ ARR datahub]</u> losses are only intended for rural use. They are not for direct use in urban areas. Furthermore, applications in New South Wales and Victoria should consider the following jurisdiction specific guidance: |
|||
| ⚫ | |||
* <u>[https://data.arr-software.org/nsw_specific NSW Specific Guidance]</u> |
|||
* <u>[https://data.arr-software.org/vic_specific VIC Specific Guidance]</u> |
|||
| ⚫ | |||
=====Probability Neutral Losses===== |
=====Probability Neutral Losses===== |
||
Probability neutral losses can be toggled on / off in the dialog (default is on). If 'on', this option will use probability neutral losses for the design burst initial loss rather than using the storm initial loss and pre- |
Probability neutral losses can be toggled on / off in the dialog (default is on). If 'on', this option will use probability neutral losses for the design burst initial loss rather than using the storm initial loss and pre-burst depths. If probability neutral losses are not available in the catchment area, then the method will automatically revert to using the storm initial loss). Currently this option cannot be used in conjunction with the '''complete storm''' option.<br><br> |
||
[[File: ARR_dialog_probability_neutral_losses_01a.png]] |
|||
[[File: ARR_dialog_probability_neutral_losses.PNG]] |
|||
<br><br> |
<br><br> |
||
| Line 117: | Line 164: | ||
=====Pre-burst Percentile===== |
=====Pre-burst Percentile===== |
||
The pre-burst percentile used to calculate design burst initial loss, or for pre-burst rainfall depth for the complete storm option, can be changed using the dropdown box in the dialog.<br><br> |
The pre-burst percentile used to calculate design burst initial loss, or for pre-burst rainfall depth for the complete storm option, can be changed using the dropdown box in the dialog.<br><br> |
||
[[File: |
[[File: ARR_dialog_preburst_01a.png]] |
||
<br><br> |
<br><br> |
||
=====User Defined Losses===== |
=====User Defined Losses===== |
||
Users can use their own rainfall loss values. The initial loss value will be treated as a complete storm value and not just for the design burst. For most regions, the design burst loss will be calculated my removing the pre-burst depth from the input loss value. If probability neutral losses are available, the burst initial loss will be calculated using the following equation:<br> |
Users can use their own rainfall loss values. The initial loss value will be treated as a complete storm value and not just for the design burst. For most regions, the design burst loss will be calculated my removing the pre-burst depth from the input loss value. If probability neutral losses are available, the burst initial loss will be calculated using the following equation:<br> |
||
: <tt>IL burst = User IL x IL ARR Prob Neutral / IL ARR Complete Storm</tt><Br><br> |
: <tt>IL burst = User IL x IL ARR Prob Neutral / IL ARR Complete Storm</tt><Br><br> |
||
[[File: |
[[File: ARR_dialog_user_losses_01a.png]] |
||
<br><br> |
<br><br> |
||
=====Event Independent Continuing Loss===== |
=====Event Independent Continuing Loss===== |
||
The event independent continuing loss only affects how the TUFLOW output files are written. This option will remove the continuing loss variable and will instead input the value directly. Ths option was added since the continuing loss value is (currently) event independent and therefore simplifies the output and also makes editing this value easier. |
The event independent continuing loss only affects how the TUFLOW output files are written. This option will remove the continuing loss variable and will instead input the value directly. Ths option was added since the continuing loss value is (currently) event independent and therefore simplifies the output and also makes editing this value easier. |
||
| Line 130: | Line 179: | ||
=====Impervious Losses===== |
=====Impervious Losses===== |
||
The impervious loss value adds the impervious loss values to the materials.csv output. This option only affects the rainfall excess loss approach.<br><br> |
The impervious loss value adds the impervious loss values to the materials.csv output. This option only affects the rainfall excess loss approach.<br><br> |
||
[[File: |
[[File: ARR_example_impervious_losses_01a.png]] |
||
<br><br> |
<br><br> |
||
=====TUFLOW Loss Method===== |
=====TUFLOW Loss Method===== |
||
The loss method used by TUFLOW can be changed using the '''TUFLOW Loss Method''' dropdown box: |
The loss method used by TUFLOW can be changed using the '''TUFLOW Loss Method''' dropdown box: |
||
* '''Infiltration (soil file)''' - will output files for the infiltration approach in TUFLOW. This approach in TUFLOW applies the total rainfall to the 2D grid and ponded water in the 2D domain can then infiltrate based on the underlying soil type and impervious fraction. See TUFLOW Manual for more information. |
* '''Infiltration (soil file)''' - will output files for the infiltration approach in TUFLOW. This approach in TUFLOW applies the total rainfall to the 2D grid and ponded water in the 2D domain can then infiltrate based on the underlying soil type and impervious fraction. See <u>[https://docs.tuflow.com/classic-hpc/manual/latest/ TUFLOW Manual]</u> for more information. |
||
* '''Rainfall Excess (material file)''' - will output files for the rainfall excess approach in TUFLOW. This approach removes the losses from the rainfall inflow prior to application so only excess rainfall is added to the model. |
* '''Rainfall Excess (material file)''' - will output files for the rainfall excess approach in TUFLOW. This approach removes the losses from the rainfall inflow prior to application so only excess rainfall is added to the model. |
||
<br> |
<br> |
||
[[File: |
[[File: ARR_dialog_tuflow_loss_method_01a.png]] |
||
<br><br> |
<br><br> |
||
=====Initial Losses For Durations Less Than 1 Hour===== |
=====Initial Losses For Durations Less Than 1 Hour===== |
||
This selects the method for determining intial loss values for events less than 1 hr in duration: |
This selects the method for determining intial loss values for events less than 1 hr in duration: |
||
* '''Interpolate to zero''' - will linearly interpolate loss values (assuming a loss value of 0 mm for 0 min) |
* '''Interpolate to zero''' - will linearly interpolate loss values (assuming a loss value of 0 mm for 0 min) |
||
* '''Log-Interpolate to zero''' - will use a log-linear interpolation (duration will use a log scale) (assuming a loss value of 0 mm for 0 min) |
|||
* '''Static Value''' - uses a user defined value for all event magnitudes |
* '''Static Value''' - uses a user defined value for all event magnitudes |
||
* '''Use 60 min Losses''' - uses the 60 min loss values |
* '''Use 60 min Losses''' - uses the 60 min loss values |
||
* '''Rahmen et al 2002''' - uses an equation determined by a study conducted by Rahmen et all in 2002 |
* '''Rahmen et al 2002''' - uses an equation determined by a study conducted by Rahmen et all in 2002 |
||
* '''Hill et al 1996:1998''' - uses an equation determined by a study conducted by Hill et all 1996:1998. This requires the user to provide a mean annual rainfall value. |
* '''Hill et al 1996:1998''' - uses an equation determined by a study conducted by Hill et all 1996:1998. This requires the user to provide a mean annual rainfall value. |
||
* '''Interpolate pre-burst''' - will linearly interpolate pre-burst depths (rather than losses) (assuming a depth of 0 mm for 0 min) |
|||
* '''Log-Interpolate pre-burst''' - will use a log-linear interpolation on the pre-burst depths (duration will use a log scale) (assuming a depth of 0 mm for 0 min) |
|||
<br> |
<br> |
||
[[File: |
[[File: ARR_dialog_losses_less_than_1h_01a.png]] |
||
<br><br> |
<br><br> |
||
<b>An example of the differences in initial losses from a few of the methods:</b><Br> |
|||
[[File: arr_to_tuflow_loss_interpolation.png]] |
|||
<br><br> |
|||
====Output Complete Storm==== |
====Output Complete Storm==== |
||
The user can choose to output the complete storm (preburst + design burst) rather than just the design burst by checking on the following option (please see ARR Book 2 Chapter 5 [Section 5.9.9] for more information):<br> |
The user can choose to output the complete storm (preburst + design burst) rather than just the design burst by checking on the following option (please see ARR Book 2 Chapter 5 [Section 5.9.9] for more information):<br> |
||
[[File: |
[[File: ARR_complete_storm_checkbox_01a.png]]<br> |
||
The complete storm generated by the tool will be the preburst depth (from the '''Preburst percentile''' extracted from the datahub) plus the design burst. The user will be required to select a preburst temporal pattern from the options listed below. The options below have been included at the request of users and are not a direct reference to any specific methodology outline in ARR. If you would like to see another method included, please email |
The complete storm generated by the tool will be the preburst depth (from the '''Preburst percentile''' extracted from the datahub) plus the design burst. The user will be required to select a preburst temporal pattern from the options listed below. The options below have been included at the request of users and are not a direct reference to any specific methodology outline in ARR. If you would like to see another method included, please email <u>[mailto:support@tuflow.com support@tuflow.com]</u>.<br> |
||
Currently the ARR to TUFLOW tool supports the following preburst temporal pattern methods: |
Currently the ARR to TUFLOW tool supports the following preburst temporal pattern methods: |
||
* '''Constant Rate''' - This will apply the preburst depth equally over a given time period. The time period can be specified as an absolute time (either as minutes or hours) or proprotional to the design storm e.g. a proportional value of 0.5 will apply a 30 min preburst to a 1 hr storm and a 15 min preburst to a 30 min storm. |
* '''Constant Rate''' - This will apply the preburst depth equally over a given time period. The time period can be specified as an absolute time (either as minutes or hours) or proprotional to the design storm e.g. a proportional value of 0.5 will apply a 30 min preburst to a 1 hr storm and a 15 min preburst to a 30 min storm. |
||
* '''Temporal Pattern''' - This will apply the preburst depth using a temporal pattern obtained from the datahub for a given duration. The preburst duration can either be an absolute time or be proportional to the design storm. The user will need to select which temporal pattern to use (e.g. TP01, TP02,... TP10). Note: there is a minimum preburst duration of 10 min for this method. |
* '''Temporal Pattern''' - This will apply the preburst depth using a temporal pattern obtained from the datahub for a given duration. The preburst duration can either be an absolute time or be proportional to the design storm. The user will need to select which temporal pattern to use (e.g. TP01, TP02,... TP10). Note: there is a minimum preburst duration of 10 min for this method. |
||
** If "design burst" is selected, this will cause the pre-burst temporal pattern to use the same temporal pattern number as the design burst (e.g. TP01 design burst will use TP01 pre-burst, TP02 design burst will use TP02 pre-burst, etc.) |
|||
The initial loss value output in this method will be the raw storm initial loss value from the datahub with no post processing. Note, the complete storm option and using probability neutral losses are mutually exclusive and aren't able to be used together.<br> |
The initial loss value output in this method will be the raw storm initial loss value from the datahub with no post processing. Note, the complete storm option and using probability neutral losses are mutually exclusive and aren't able to be used together.<br> |
||
Preburst temporal pattern and duration details are ignored if the "Use Complete Storm" checkbox is not selected. |
Preburst temporal pattern and duration details are ignored if the "Use Complete Storm" checkbox is not selected. |
||
<br><br> |
<br><br> |
||
====Why Is the Tool Outputting Negative Loss Values?==== |
====Why Is the Tool Outputting Negative Loss Values?==== |
||
The tool will output negative loss values when the preburst depth is greater than the storm initial loss. The tool will not floor loss values at zero since the value may be useful in helping the user determine the appropriate course of action. E.g. if IL = -1mm, this may be considered negligible and can be simply set to zero. An IL = -50mm may be considered significant enough that it simply can't be set to zero and alternate, or sensitivity runs, may need to be carried out, like using a <u |
The tool will output negative loss values when the preburst depth is greater than the storm initial loss. The tool will not floor loss values at zero since the value may be useful in helping the user determine the appropriate course of action. E.g. if IL = -1mm, this may be considered negligible and can be simply set to zero. An IL = -50mm may be considered significant enough that it simply can't be set to zero and alternate, or sensitivity runs, may need to be carried out, like using a <u>[[#Output_Complete_Storm | Complete Storm]]</u>. |
||
===Areal Reduction Factors=== |
===Areal Reduction Factors=== |
||
| Line 170: | Line 230: | ||
* '''ARF for events < 50% AEP''' - this will calculate ARF values using the same equations used for larger events |
* '''ARF for events < 50% AEP''' - this will calculate ARF values using the same equations used for larger events |
||
<br> |
<br> |
||
[[File: |
[[File: ARR_dialog_ARF_01a.png]] |
||
<br><br> |
<br><br> |
||
| Line 178: | Line 238: | ||
* '''Output Notation''' - users can toggle between '% AEP' and 'yr ARI' output notation. |
* '''Output Notation''' - users can toggle between '% AEP' and 'yr ARI' output notation. |
||
<br> |
<br> |
||
[[File: |
[[File: ARR_dialog_output_options_01a.png]] |
||
<br><br> |
<br><br> |
||
| Line 186: | Line 246: | ||
* BOM_raw_web_<catchment_name>.html |
* BOM_raw_web_<catchment_name>.html |
||
<br> |
<br> |
||
[[File: |
[[File: ARR_dialog_offline_inputs_01a.png]] |
||
<br><br> |
<br><br> |
||
| Line 194: | Line 254: | ||
* the tool can't access a network location |
* the tool can't access a network location |
||
* there is no internet connection |
* there is no internet connection |
||
* the ARR |
* the ARR Datahub or BOM is down (see <u>[[#Can.27t_access_the_websites | Can't Access the Websites]]</u> section below) |
||
A useful check if you're unsure if the issue is with the tool or with something else (like the Datahub), is to check if you can manually access and pull data from the Datahub for your catchment site. |
A useful check if you're unsure if the issue is with the tool or with something else (like the Datahub), is to check if you can manually access and pull data from the Datahub for your catchment site. |
||
<br><br> |
<br><br> |
||
The second step is to ensure you're using the latest version of the QGIS plugin. |
The second step is to ensure you're using the latest version of the QGIS plugin. Occasionally updates to the ARR Datahub will break the tool and this may have already been caught and fixed in the latest update.<Br><br> |
||
===Issue With The Tool=== |
===Issue With The Tool=== |
||
If there's an issue with the tool, or you are unsure, please contact [mailto:support@tuflow.com support@tuflow.com] for help. Please include a description of the problem, the log file, and the GIS catchment layer with your email.<br><br> |
If there's an issue with the tool, or you are unsure, please contact <u>[mailto:support@tuflow.com support@tuflow.com]</u> for help. Please include a description of the problem, the log file, and the GIS catchment layer with your email.<br><br> |
||
===Can't access the websites=== |
===Can't access the websites=== |
||
Sometimes the BOM or ARR Datahub websites are down or unable to be accessed by the tool (e.g. sometimes to manage traffic, the Datahub server will limit, or disallow scraping). The below are a set of instructions that can be used as a workaround should this occur: |
Sometimes the BOM or ARR Datahub websites are down or unable to be accessed by the tool (e.g. sometimes to manage traffic, the Datahub server will limit, or disallow scraping). The below are a set of instructions that can be used as a workaround should this occur: |
||
*[[ARR_DATAHUB_CANNOT_BE_ACCESSED | ARR |
*<u>[[ARR_DATAHUB_CANNOT_BE_ACCESSED | ARR Datahub website cannot be accessed by the tool]]</u> |
||
<br> |
<br> |
||
{{Tips Navigation |
{{Tips Navigation |
||
Latest revision as of 16:34, 1 June 2026
The ARR to TUFLOW utility has been developed to help users set up a TUFLOW model that uses Australian Rainfall and Runoff (ARR) input parameters and the Australian Bureau of Meteorology (BOM) rainfall by automating the collection and processing of the data. The inputs and outputs of the tool are explained in detail below. Note: this tool helps with data processing, however is not a substitute to reading ARR. Similarly this wiki page discusses the use of the tool and the options, however context should be derived from ARR directly. Please see the ARR Website for more information.
Getting Started
Installation
The ARR to TUFLOW tool is a free tool that comes as part of the TUFLOW plugin in QGIS. For instructions on how to install the plugin, please see: QGIS TUFLOW Plugin Installation
There are also instructions on installing plugins in the QGIS documentation - if you choose to follow the QGIS documentation, the plugin is called "TUFLOW" in the repository: Link to QGIS Documentation - Installing and Managing Plugins
QGIS Version
The ARR to TUFLOW tool is, for the most part (see note below), a Python tool that runs independently of QGIS. Therefore the tool should not be sensitive to the installed QGIS version, however occasionally QGIS will update the Python version that is packaged with the installation which means there is a small risk that the tool will break between QGIS versions. If the tool does break, please see The Tool Isn't Working for information (the solution is most likely to update the plugin rather than re-install an older version of QGIS).
Note: The tool does use QGIS for pre-processing tasks, such as area and centroid calculation as well as reprojection or cartesian to long-lat.
Opening The ARR to TUFLOW Tool
Once the TUFLOW plugin is installed, the ARR to TUFLOW tool can be opened by clicking the following icon in the plugin toolbar:

Quickstart
- Load a catchment GIS file (e.g. shp file) into QGIS - this can either be a polygon or point layer
- Open the ARR to TUFLOW tool
- Select the GIS catchment layer in Input Catchment File dropdown box.
- Select the attribute field to use as the catchment name in the Unique Catchment Identifier Field dropdown.
- Select storm event combinations from the list of magnitudes and durations.
- Choose an output location.
- Click OK and wait for the tool to finish.


Output
Log File
A log file (<catchment_name>_log.txt) will be written to the output folder. The log file will contain all WARNING and ERROR messages as well as logged inputs and processing steps. It's recommended to check the log file after running the tool for any warning or error messages. Most warning messages will be grouped together near the bottom of the log file to make it easier to review them.
Data Output
The following outputs are located in the folder <output_folder>\data
- Raw BOM and ARR Datahub outputs
- ARR_Web_data_<catchment_name>.txt
- BOM_raw_web_<catchment_name>.html
- Areal_<TP_Zone>_Increments.csv (Areal temporal patterns)
- Rainfall depths
- BOM_Rainfall_Depths_<catchment_name>.csv - processed rainfall depths (after ARF factors)
- ARF Factors
- <catchment_name>_ARF_Factors.csv - calculated ARF factors
- Storm Burst Rainfall Losses
- <catchment_name>_Burst_Initial_Loss.csv - calculated Storm Burst Initial Rainfall Losses (Complete Storm Initial Loss - Preburst Rainfall Depth)
TUFLOW Output
The following outputs are generated by the utility for input into TUFLOW. Please see the example below on how to use the output files for a model.
- TUFLOW Rainfall Inflows
- The rainfall inflows are output in the following location <output_folder>\rf_inflows. This output folder is where all the direct rainfall inflows that would be used in the TUFLOW model are output. An inflow file is generated for each event magnitude - duration combination. All available temporal patterns are included in a single file (including climate change options).
- bc_dbase.csv
- TUFLOW boundary condition database. Setup to point to the RF folder with wildcards applied.
- event_file.tef
- TUFLOW Event File. Setup with wildcards applied. To keep the file names from becoming overly long and complicated, Climate Change scenarios are labelled as CC1, CC2.. etc. These correspond to the combinations of climate change scenarios requested by the user e.g. 2090_8.5 (climate change year: 2090, RCP: 8.5)
- soil_infiltration.trd or rainfall_losses.trd - the name of the file will be dependent on the selected loss method, but they are essentially the same file
- This file is a TUFLOW Read File (.trd) that contains variable initialisation for initial and continuing loss values
- soils.tsoilf or materials.csv - which file is output will be dependent on the selected loss method
- soils.tsoilf - rainfall loss file for the infiltration loss method
- materials.csv - rainfall loss file for the rainfall excess method
Example: Using the outputs in a TUFLOW model
Additional Options
Climate Change
Climate change options can be added by clicking on Edit under the climate change section. This opens up a table widget that the user can then add/remove climate change scenarios based on the guidance in ARR v4.2. Once a user adds a scenario (green plus), they can double click on the values to change them. For example, double clicking on SSP2-4.5 under the 'SSP' heading will show the available Shared Socioeconomic Pathway (SSP) options. Scenarios added in the table will be displayed in the climate change section (underneath the edit button). Note: each scenario name must be unique and generally the table widget will force unique names. The scenario names will be used throughout the outputs and the user is free to customise the scenario names as they want.
The table columns within the table widget are based on ARR guidelines v4.2 and the examples presented in Book 1, Chapter 6. Please note the following assumptions:
- Near-term horizon = 2030
- Medium-term horizon = 2050
- Long-term horizon = 2090
- Temperature Change - Setting this to -1 will adopt the temperature changes output in the climate change part of the ARR datahub download. If a value of zero or greater is set by the user, this will be adopted instead of the datahub values and it will be assumed that these are changes relative to the pre-industrial period. Note: the temperature change will be stopped from going negative within the calculation.
By adding climate change scenarios, the following outputs will be turned on:
- An extra boundary database file: bc_dbase_CC.csv
- Climate change inflows will be appended to the end of each event's inflow file
- One additional event option will also be added to the event file for each combination of selected climate change scenarios labelled based on the scenario name. It is intended that the climate change scenarios would be treated as a separate event (e1 = magnitude, e2 = duration, e3 = temporal pattern, e4 = climate change scenario) however the output files can easily be manipulated by the user to configure the model differently.
- The following CSV files will be written to the data output folder:
- <scen_name>_rainfall_factors.csv
- <scen_name>_rainfall_depths.csv
- <scen_name>_losses.csv


LIMB Data and Climate Change
The LIMB sub-daily rainfall data midpoint is 2002, which differs from the ARR baseline period of 1990. Below is a worked example of applying a baseline change in the tool for the Near term and SSP2-4.5 scenario. Note, this is not required for daily or longer rainfall durations.
Reference document:
https://data.arr-software.org/static/pdf/LIMB_Addendum_climate_change_considerations.pdf
- Calculate the difference in temperature, comparing the ARR values to the LIMB values:
- From ARR v4.2 Book 1, Chapter 6, Table 1.6.2: Temperature change = 1.2
- From the LIMB reference document above, Table 3: Temperature change = 0.66
- Therefore, baseline temperature change = 0.54
- Update the "Baseline Change" value in the climate change dialog within the ARR to TUFLOW tool.
- Run the tool and check that the climate change uplift factors match the values referenced in the LIMB reference document Appendix A tables.

Temporal Patterns
Temporal pattern options can be found by expanding the Temporal Patterns section in the dialog.
- Manually Specify Point Temporal Patterns (csv) - lets the user specify the point temporal patterns which is expected to be in the ARR datahub format
- Manually Specify Areal Temporal Patterns (csv) - lets the user specify the arealtemporal patterns which is expected to be in the ARR datahub format
- Optional Additional Temporal Patterns - Lets the user add additional temporal patterns in a couple of different ways:
- The user can choose to add temporal patterns from other temporal pattern regions. This is only if the user wishes to included additional temporal patterns. The temporal patterns from the catchment location (taken at the catchment centroid) will always be included. The additional temporal patterns will be included in the inflow files and added to the event file.
- The user can choose to add temporal patterns from other temporal pattern bins within the same region. For point temporal patterns, this would add temporal patterns from the 'frequent', 'intermediate', and 'rare' bins. For areal temporal patterns, this would add temporal patterns from other "Area" bins. The "correct" bin will always make up the first 10 temporal patterns (TP01 to TP10).
- For Areal temporal patterns - The user has the additional option to choose how many additional areal temporal pattern sets to add. The default is 2 as this matches the number of additional point temporal patterns that would be added (but it doesn't necessarily have to be the same). The "Area" bins chosen will be the next closest in order.


Rainfall
LIMB Rainfall Data
Since v3.8.2.16 ( development version), LIMB data will be used for rainfall depths where available (SEQ specific). The user has the option of selecting the IFD curve from the available sets:
- Enveloped (Default)
- High Resolution
- BOM Resolution
The user also has the option of turning off LIMB data and using BOM 2016 rainfall data instead. If LIMB data is not available, the tool will default to BOM data.
If the user has selected AEP or durations outside of the provided LIMB data range, the tool will use BOM 2016 rainfall data. If the user has selected AEP or durations within the LIMB data range, but the value is not part of the provided IFD, the tool will interpolate the rainfall depth from the provided LIMB data.

Rainfall Losses
The following sections summarise the available loss options. Please note, as recommended in ARR2019, ARR datahub losses are only intended for rural use. They are not for direct use in urban areas. Furthermore, applications in New South Wales and Victoria should consider the following jurisdiction specific guidance:
Note: Since version v3.5 initial loss for durations greater than 72 hrs is assumed to be the same as the initial loss for 72 hrs. Previous to this version, these losses were output as zeros.
Probability Neutral Losses
Probability neutral losses can be toggled on / off in the dialog (default is on). If 'on', this option will use probability neutral losses for the design burst initial loss rather than using the storm initial loss and pre-burst depths. If probability neutral losses are not available in the catchment area, then the method will automatically revert to using the storm initial loss). Currently this option cannot be used in conjunction with the complete storm option.

NSW Continuing Loss
Continuing loss values for NSW will be automatically multiplied by 0.4. This will be reported in the log file as:
- "Catchment is in NSW, multiplying Datahub continuing loss by 0.4"
Pre-burst Percentile
The pre-burst percentile used to calculate design burst initial loss, or for pre-burst rainfall depth for the complete storm option, can be changed using the dropdown box in the dialog.
![]()
User Defined Losses
Users can use their own rainfall loss values. The initial loss value will be treated as a complete storm value and not just for the design burst. For most regions, the design burst loss will be calculated my removing the pre-burst depth from the input loss value. If probability neutral losses are available, the burst initial loss will be calculated using the following equation:
- IL burst = User IL x IL ARR Prob Neutral / IL ARR Complete Storm

Event Independent Continuing Loss
The event independent continuing loss only affects how the TUFLOW output files are written. This option will remove the continuing loss variable and will instead input the value directly. Ths option was added since the continuing loss value is (currently) event independent and therefore simplifies the output and also makes editing this value easier.
Impervious Losses
The impervious loss value adds the impervious loss values to the materials.csv output. This option only affects the rainfall excess loss approach.

TUFLOW Loss Method
The loss method used by TUFLOW can be changed using the TUFLOW Loss Method dropdown box:
- Infiltration (soil file) - will output files for the infiltration approach in TUFLOW. This approach in TUFLOW applies the total rainfall to the 2D grid and ponded water in the 2D domain can then infiltrate based on the underlying soil type and impervious fraction. See TUFLOW Manual for more information.
- Rainfall Excess (material file) - will output files for the rainfall excess approach in TUFLOW. This approach removes the losses from the rainfall inflow prior to application so only excess rainfall is added to the model.

Initial Losses For Durations Less Than 1 Hour
This selects the method for determining intial loss values for events less than 1 hr in duration:
- Interpolate to zero - will linearly interpolate loss values (assuming a loss value of 0 mm for 0 min)
- Log-Interpolate to zero - will use a log-linear interpolation (duration will use a log scale) (assuming a loss value of 0 mm for 0 min)
- Static Value - uses a user defined value for all event magnitudes
- Use 60 min Losses - uses the 60 min loss values
- Rahmen et al 2002 - uses an equation determined by a study conducted by Rahmen et all in 2002
- Hill et al 1996:1998 - uses an equation determined by a study conducted by Hill et all 1996:1998. This requires the user to provide a mean annual rainfall value.
- Interpolate pre-burst - will linearly interpolate pre-burst depths (rather than losses) (assuming a depth of 0 mm for 0 min)
- Log-Interpolate pre-burst - will use a log-linear interpolation on the pre-burst depths (duration will use a log scale) (assuming a depth of 0 mm for 0 min)

An example of the differences in initial losses from a few of the methods:

Output Complete Storm
The user can choose to output the complete storm (preburst + design burst) rather than just the design burst by checking on the following option (please see ARR Book 2 Chapter 5 [Section 5.9.9] for more information):

The complete storm generated by the tool will be the preburst depth (from the Preburst percentile extracted from the datahub) plus the design burst. The user will be required to select a preburst temporal pattern from the options listed below. The options below have been included at the request of users and are not a direct reference to any specific methodology outline in ARR. If you would like to see another method included, please email support@tuflow.com.
Currently the ARR to TUFLOW tool supports the following preburst temporal pattern methods:
- Constant Rate - This will apply the preburst depth equally over a given time period. The time period can be specified as an absolute time (either as minutes or hours) or proprotional to the design storm e.g. a proportional value of 0.5 will apply a 30 min preburst to a 1 hr storm and a 15 min preburst to a 30 min storm.
- Temporal Pattern - This will apply the preburst depth using a temporal pattern obtained from the datahub for a given duration. The preburst duration can either be an absolute time or be proportional to the design storm. The user will need to select which temporal pattern to use (e.g. TP01, TP02,... TP10). Note: there is a minimum preburst duration of 10 min for this method.
- If "design burst" is selected, this will cause the pre-burst temporal pattern to use the same temporal pattern number as the design burst (e.g. TP01 design burst will use TP01 pre-burst, TP02 design burst will use TP02 pre-burst, etc.)
The initial loss value output in this method will be the raw storm initial loss value from the datahub with no post processing. Note, the complete storm option and using probability neutral losses are mutually exclusive and aren't able to be used together.
Preburst temporal pattern and duration details are ignored if the "Use Complete Storm" checkbox is not selected.
Why Is the Tool Outputting Negative Loss Values?
The tool will output negative loss values when the preburst depth is greater than the storm initial loss. The tool will not floor loss values at zero since the value may be useful in helping the user determine the appropriate course of action. E.g. if IL = -1mm, this may be considered negligible and can be simply set to zero. An IL = -50mm may be considered significant enough that it simply can't be set to zero and alternate, or sensitivity runs, may need to be carried out, like using a Complete Storm.
Areal Reduction Factors
Areal reduction factor options can be changed in the ARF section:
- Calculate Area - will calculate the catchment area using the GIS feature in QGIS. For point objects, this will be set to zero and no ARF will be applied (i.e. a value of 1.0)
- User Area - will let the user define the area. This can either be done by selecting an attribute field that contains the catchment area, or by entering a value. All user inputs will be assumed to be in square km.
- Minimum ARF - this value sets a floor for the calculated ARF values
- ARF for events < 50% AEP - this will calculate ARF values using the same equations used for larger events

Additional Output Options
Additional output options include:
- Output Format - can choose to output in either csv or ts1 format. Ts1 files will be quicker to read in by TUFLOW, however the difference may not be substantial depending on how many are being read in. TUFLOW will also use .xf files by default which means that the raw data is only processed if there is a change, and subsequent runs will not suffer from any slow down from having to read csv files.
- Output Notation - users can toggle between '% AEP' and 'yr ARI' output notation.

Offline Mode
Offline can be used to pass in data that has already been pulled from the ARR datahub and BOM. This can be useful if the user would like to make use of new features in the tool, however would like to ensure they are getting consistent results with previous data that was pulled from the BOM and the ARR datahub. The files required to process offline are saved as part of the tool's process when pulling from the web. Currently offline mode doesn't support areal temporal patterns directly, however this can easily be added by using the manually specify areal temporal pattern option:
- ARR_Web_data_<catchment_name>.txt
- BOM_raw_web_<catchment_name>.html

The Tool Isn't Working
The first step in identifying the problem is to check the log file. The issue may be something simple like:
- one of the files the tool is trying to write to is locked by a process or user (e.g. one of the outputs is open in Excel)
- the tool can't access a network location
- there is no internet connection
- the ARR Datahub or BOM is down (see Can't Access the Websites section below)
A useful check if you're unsure if the issue is with the tool or with something else (like the Datahub), is to check if you can manually access and pull data from the Datahub for your catchment site.
The second step is to ensure you're using the latest version of the QGIS plugin. Occasionally updates to the ARR Datahub will break the tool and this may have already been caught and fixed in the latest update.
Issue With The Tool
If there's an issue with the tool, or you are unsure, please contact support@tuflow.com for help. Please include a description of the problem, the log file, and the GIS catchment layer with your email.
Can't access the websites
Sometimes the BOM or ARR Datahub websites are down or unable to be accessed by the tool (e.g. sometimes to manage traffic, the Datahub server will limit, or disallow scraping). The below are a set of instructions that can be used as a workaround should this occur:
| Up |
|---|