TUFLOW 2D Hydraulic Structures: Difference between revisions
Teegan.Burke (talk | contribs) |
|||
| (13 intermediate revisions by 2 users not shown) | |||
| Line 1: | Line 1: | ||
= 2D Structure Modelling Theory = |
= 2D Structure Modelling Theory = |
||
The theory behind the modelling of energy losses and affluxes of hydraulic structures is presented in the following webinars by Bill Syme and Greg Collecutt (TUFLOW Developers). |
|||
These webinars by Bill Syme and Greg Collecutt (the TUFLOW Developers) discus the theory behind the energy losses and affluxes modelling associated with hydraulic structures. |
|||
*<u>[https://www.tuflow.com/library/webinars/#structures Webinar Link: Modelling Energy Losses at Structures]</u><br> |
*<u>[https://www.tuflow.com/library/webinars/#structures Webinar Link: Modelling Energy Losses at Structures]</u><br> |
||
| Line 16: | Line 16: | ||
Piers are usually smaller than the 2D cell size in real-world flood models. Although flexible mesh solver or quadtree refinement can be applied to reduce the local cell size around the pier, it also comes with an expensive computational cost that could significantly increase the simulation time. More practically, the backwater effect of piers can be modelled as sub-grid form losses. |
Piers are usually smaller than the 2D cell size in real-world flood models. Although flexible mesh solver or quadtree refinement can be applied to reduce the local cell size around the pier, it also comes with an expensive computational cost that could significantly increase the simulation time. More practically, the backwater effect of piers can be modelled as sub-grid form losses. |
||
Pier form loss coefficients can be derived from information in publications such as <u>[https://www.fhwa.dot.gov/engineering/hydraulics/library_arc.cfm?pub_number=1&id=5 ''Hydraulics of Bridge Waterways'' (Bradly, 1978)] or [https://austroads.com.au/publications/bridges/agbt08 ''Guide to Bridge Technology Part 8: Hydraulic Design of Waterway Structures'' (AUSTROADS, |
Pier form loss coefficients can be derived from information in publications such as <u>[https://www.fhwa.dot.gov/engineering/hydraulics/library_arc.cfm?pub_number=1&id=5 ''Hydraulics of Bridge Waterways'' (Bradly, 1978)] or [https://austroads.com.au/publications/bridges/agbt08 ''Guide to Bridge Technology Part 8: Hydraulic Design of Waterway Structures'' (AUSTROADS, 2018)]</u>. Energy loss estimated from bridge piers or other obstructions, vertical or horizontal, that do not cause upstream controlled flow regimes like pressure flow, are dependent on the ratio of the obstruction's area perpendicular to the flow direction to the gross flow area of the bridge opening, the shape of the piers or obstruction, and the angularity of the piers/obstruction to the flow direction. For example, using Hydraulics of Bridge Waterways (Bradly, 1978) the approach is: |
||
<ol> |
<ol> |
||
<li>Calculate the ratio of the water area occupied by piers to the gross water area of the constriction (both based on the normal water surface) and the angularity of the piers. These inputs are used to calculate "J" in the FHA documentation.</li> |
<li>Calculate the ratio of the water area occupied by piers to the gross water area of the constriction (both based on the normal water surface) and the angularity of the piers. These inputs are used to calculate "J" in the FHA documentation.</li> |
||
<li>Use the Figure |
<li>Use the Figure 4.10 ''Incremental Backwater Coefficient for Piers'' data to calculate Kp. <br> |
||
[[File:incremental_backwater_coefficient_2018_pier_losses.png]] |
|||
[[File:FHA_Kp_arrow_crop.png|400px]] |
|||
<br> |
<br> |
||
'''NOTE''': the pier form loss coefficients in Hydraulics of Bridge Waterways are derived based on the cross-sectional averaged velocity through the bridge opening in the absence of piers. It's not necessary to specify a blockage value if a pier form loss coefficient estimated from this method is used. |
'''NOTE''': the pier form loss coefficients in Hydraulics of Bridge Waterways are derived based on the cross-sectional averaged velocity through the bridge opening in the absence of piers. It's not necessary to specify a blockage value if a pier form loss coefficient estimated from this method is used. |
||
| Line 56: | Line 56: | ||
*If the hB/T ratio is less than 2 or greater than 6, use a peak form loss coefficient of 0.42 (minimum) or 0.20 (maximum), respectively. |
*If the hB/T ratio is less than 2 or greater than 6, use a peak form loss coefficient of 0.42 (minimum) or 0.20 (maximum), respectively. |
||
'''NOTE''': This form loss value should not be confused with the value of 1.56 used in the pressure flow approached adopted in <u>[[1D_Bridges | TUFLOW 1D "B" and "BB" bridge]]</u>. TUFLOW 1D bridge pressure flow approach is based on the section 4.13.2 "All Girders in Contact with Flow (Case II)" of ''Guide to Bridge Technology Part 8: Hydraulic Design of Waterway Structures'' (AUSTROADS, |
'''NOTE''': This form loss value should not be confused with the value of 1.56 used in the pressure flow approached adopted in <u>[[1D_Bridges | TUFLOW 1D "B" and "BB" bridge]]</u>. TUFLOW 1D bridge pressure flow approach is based on the section 4.13.2 "All Girders in Contact with Flow (Case II)" of ''Guide to Bridge Technology Part 8: Hydraulic Design of Waterway Structures'' (AUSTROADS, 2018). The original hydraulic experiment conducted by <u>[https://hdl.handle.net/10217/39009 Liu et al (1957)]</u> in a laboratory flume with a pair of bridge abutments and a deck. The flow conditions were similar to orifice flow due to the high blockage ratio caused by the abutments and the deck. When modelling bridges in 2D, the contraction/expansion losses caused by the abutments would be handled explicitly by the 2D solver, so a value 1.56 can lead to duplication of the contraction/expansion losses caused by the bridge abutments.<br> |
||
<br> |
<br> |
||
| Line 74: | Line 74: | ||
Four flow constriction layers are represented in a 2d_lfcsh layer. The lower three layers represents the pier, the bridge deck and the rails. Each layer has its own attributes to specify the blockage and the form loss coefficient. The top (fourth) layer assumes the flow is unimpeded, representative of flow over the top of a bridge. Within the same shape, the invert of the bed, and thickness of each layer can vary in 3D. |
Four flow constriction layers are represented in a 2d_lfcsh layer. The lower three layers represents the pier, the bridge deck and the rails. Each layer has its own attributes to specify the blockage and the form loss coefficient. The top (fourth) layer assumes the flow is unimpeded, representative of flow over the top of a bridge. Within the same shape, the invert of the bed, and thickness of each layer can vary in 3D. |
||
The following table provides an overview for how to determine the blockage and form loss coefficient for each layer |
The following table provides an overview for how to determine the blockage and form loss coefficient for each layer. Note that this is just an overview and additional guidelines may need to be considered.<br> |
||
{| style="text-align: left; margin-left: 0; " class="wikitable" width="80%" |
{| style="text-align: left; margin-left: 0; " class="wikitable" width="80%" |
||
!colspan="1" style="background-color:#005581; font-weight:bold; color:white;"| Layer |
!colspan="1" style="background-color:#005581; font-weight:bold; color:white;"| Layer |
||
| Line 98: | Line 98: | ||
|} |
|} |
||
<ol> |
<ol> |
||
[[File: |
[[File:2d_lfcsh_attributes_02.jpg|700px]] |
||
</ol> |
</ol> |
||
<br> |
<br> |
||
| Line 188: | Line 188: | ||
2D BG Shape is similar to the Layered Flow Constriction, but has several updates to simplify the input based on the findings from the joint study with TMR <u>[https://tuflow.com/media/7554/2022-bridge-deck-afflux-modelling-benchmarking-of-cfd-and-swe-codes-to-real-world-data-collecutt-et-al-hwrs.pdf (Collecutt et al, 2022)]</u>. |
2D BG Shape is similar to the Layered Flow Constriction, but has several updates to simplify the input based on the findings from the joint study with TMR <u>[https://tuflow.com/media/7554/2022-bridge-deck-afflux-modelling-benchmarking-of-cfd-and-swe-codes-to-real-world-data-collecutt-et-al-hwrs.pdf (Collecutt et al, 2022)]</u>. |
||
The following table provides an overview of how to determine the blockage and form loss coefficient for each layer |
The following table provides an overview of how to determine the blockage and form loss coefficient for each layer. Note that this is just an overview and additional guidelines may need to be considered.<br> |
||
{| style="text-align: left; margin-left: 0; " class="wikitable" width="80%" |
{| style="text-align: left; margin-left: 0; " class="wikitable" width="80%" |
||
!colspan="1" style="background-color:#005581; font-weight:bold; color:white;"| Layer |
!colspan="1" style="background-color:#005581; font-weight:bold; color:white;"| Layer |
||
| Line 211: | Line 211: | ||
<ol> |
<ol> |
||
[[File: |
[[File:Bridge block.jpg | 800px]] |
||
</ol> |
</ol> |
||
===Inflection Point=== |
===Inflection Point=== |
||
| Line 382: | Line 381: | ||
TUFLOW is a 2D solution (not 3D), in the 2d_lfcsh layer the percent blockage and form loss coefficient applied to the cell faces is depth averaged across the entire cell face (across Layer 1, 2 and 3):<br> |
TUFLOW is a 2D solution (not 3D), in the 2d_lfcsh layer the percent blockage and form loss coefficient applied to the cell faces is depth averaged across the entire cell face (across Layer 1, 2 and 3):<br> |
||
*For bridges, where Layer 2 has a 100% blockage applied, the minimum flow width of 0. |
*For bridges, where Layer 2 has a 100% blockage applied, the minimum flow width factor of 0.001 (i.e. 0.1%) is used and is averaged with the Layer 1 blockage (based on the depth of the water). This may result in a water level being reported within or above the bridge deck, which would represent the pressure head. |
||
*Layered flow constriction works by adjusting the flow area of the cell faces by any blockages to generate the correct depth averaged velocity at each face at which the form losses are applied as a fraction of the V<sup>2</sup>/2g kinetic energy. Calculating the correct velocity is critical for determining the losses as the losses are proportional to the velocity squared. <br> |
*Layered flow constriction works by adjusting the flow area of the cell faces by any blockages to generate the correct depth averaged velocity at each face at which the form losses are applied as a fraction of the V<sup>2</sup>/2g kinetic energy. Calculating the correct velocity is critical for determining the losses as the losses are proportional to the velocity squared. <br> |
||
*For a layered flow constriction cell face the flow area cannot be zero above the invert of Layer 1 to avoid a divide by zero in the computations, therefore a minimum |
*For a layered flow constriction cell face the flow area cannot be zero above the invert of Layer 1 to avoid a divide by zero in the computations, therefore after applying blockages, a minimum depth averaged flow width factor of 0.001 (i.e. 0.1%) is applied, which will allow a very small amount of water to flow through. |
||
*If this is unacceptable, and a 2d_lfcsh is intended to be 100% blocked, or even just Layer 1 100% blocked in the case of a fence with a solid base, then the preferred approach is to raise the ground elevation by setting the 2d_lfcsh invert attribute higher or using a 2d_zsh Z Shape modification (e.g. a breakline). <br> |
|||
<ol> |
<ol> |
||
[[File:100% Blockage Diagram.png | 500px]] |
[[File:100% Blockage Diagram.png | 500px]] |
||
| Line 415: | Line 415: | ||
== What FLC values should be used for 2d_bg bridge if hB/T is below 2 or above 6? == |
== What FLC values should be used for 2d_bg bridge if hB/T is below 2 or above 6? == |
||
TMR has extended the CFD simulation to hB/T ratios of 1 to 10. |
TMR has extended the CFD simulation to hB/T ratios of 1 to 10. Refer to the <u>[https://docs.tuflow.com/classic-hpc/manual/latest/ TUFLOW Manual]</u> for details. |
||
If hB/T is outside this ratio: |
If hB/T is outside this ratio: |
||
Latest revision as of 09:50, 13 May 2026
2D Structure Modelling Theory
The theory behind the modelling of energy losses and affluxes of hydraulic structures is presented in the following webinars by Bill Syme and Greg Collecutt (TUFLOW Developers).
- Webinar Link: Modelling Energy Losses at Structures
- Webinar Link: 1D, 2D & 3D Hydraulic Modelling of Bridges
2D Bridge Modelling in TUFLOW - Overview
The TUFLOW 2D solution explicitly predicts the majority of “macro” losses due to the expansion and contraction of water through a constriction, or around a bend, provided the resolution of the grid is sufficiently fine (Barton, 2001; Syme, 2001; Ryan, 2013). Where the 2D model is not of fine enough resolution to simulate the “micro” losses (e.g. from bridge piers, vena contracta, losses in the vertical (3rd) dimension), additional form loss coefficients and/or modifications to the cells widths and flow height need to be added.
Contraction/Expansion Losses (“Macro” Losses)
Loss of energy is caused by the flow contraction during the expansion of water after the vena-contracta inside a bridge section and the flow expansion downstream a bridge. As discussed above, this type of "macro" losses can be explicitly resolved by the TUFLOW 2D solver, provided that a proper turbulence model and mesh size are used. Below is an example of the 2D modelling of flow contraction/expansion at a pair of bridge abutments.

Pier Losses
Piers are usually smaller than the 2D cell size in real-world flood models. Although flexible mesh solver or quadtree refinement can be applied to reduce the local cell size around the pier, it also comes with an expensive computational cost that could significantly increase the simulation time. More practically, the backwater effect of piers can be modelled as sub-grid form losses.
Pier form loss coefficients can be derived from information in publications such as Hydraulics of Bridge Waterways (Bradly, 1978) or Guide to Bridge Technology Part 8: Hydraulic Design of Waterway Structures (AUSTROADS, 2018). Energy loss estimated from bridge piers or other obstructions, vertical or horizontal, that do not cause upstream controlled flow regimes like pressure flow, are dependent on the ratio of the obstruction's area perpendicular to the flow direction to the gross flow area of the bridge opening, the shape of the piers or obstruction, and the angularity of the piers/obstruction to the flow direction. For example, using Hydraulics of Bridge Waterways (Bradly, 1978) the approach is:
- Calculate the ratio of the water area occupied by piers to the gross water area of the constriction (both based on the normal water surface) and the angularity of the piers. These inputs are used to calculate "J" in the FHA documentation.
- Use the Figure 4.10 Incremental Backwater Coefficient for Piers data to calculate Kp.
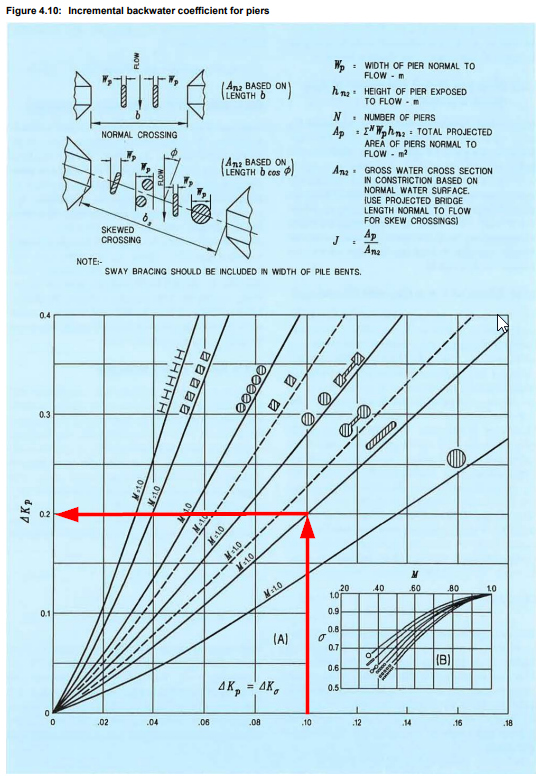
NOTE: the pier form loss coefficients in Hydraulics of Bridge Waterways are derived based on the cross-sectional averaged velocity through the bridge opening in the absence of piers. It's not necessary to specify a blockage value if a pier form loss coefficient estimated from this method is used.

Bridge Deck and Rail (Super Structure)
When a bridge deck become partially or completely submerged, the deck could generate extra afflux resulting in increased water levels and flood extents upstream of the structure. The flow around the deck is highly 3-dimentional and complexed due to the different deck designs/profiles and/or the occurrence of pressure flow. In 2D SWE solver, depth-varying form loss values are often needed to reproduce the afflux caused by such structure. Due to the complexity of the flow, guidelines on how to set the form loss coefficient for the bridge deck are rare. We have carried out a joint research with QLD TMR (Queensland Department of Transport and Main Roads) regarding how to choose a proper form loss value for the bridge deck (Collecutt et al, 2022) . In the research, CFD modelling was conducted to investigate the characteristics of energy loss of a simple bridge with a flat bottomed deck and guardrails.

Below are the key findings from the study:
- The results displayed a characteristic shape for head loss coefficient as a function of downstream water level over the deck thickness (TW/T).
- The head loss (afflux) peaks when the water level is approximately 1.6*T above the bridge soffit, and decays slowly as the bridge becomes progressively drowned out.

Bridge Design (hB/T) vs Form Loss Coefficient Table
The peak loss coefficient value is a function of the ratio of the depth underneath the deck (hB) and the thickness of the deck (T). This table can be used to estimate the deck form loss coefficient based on the bridge design (hB/T).
| Deck Height to Thickness Ratio | Peak Form Loss Coefficient |
|---|---|
| Scenario A (hB/T) = 2 | 0.42 |
| Scenario B (hB/T) = 4 | 0.28 |
| Scenario C (hB/T) = 6 | 0.20 |
- The solid portion of the guard rails (blockage * rail depth) can be added to T in addition to the deck thickness to calculate hB/T.
- For bridge with more complicated designs (e.g. girders), higher form loss might be required due to the higher surface roughness of the bridge.
- If the hB/T ratio is less than 2 or greater than 6, use a peak form loss coefficient of 0.42 (minimum) or 0.20 (maximum), respectively.
NOTE: This form loss value should not be confused with the value of 1.56 used in the pressure flow approached adopted in TUFLOW 1D "B" and "BB" bridge. TUFLOW 1D bridge pressure flow approach is based on the section 4.13.2 "All Girders in Contact with Flow (Case II)" of Guide to Bridge Technology Part 8: Hydraulic Design of Waterway Structures (AUSTROADS, 2018). The original hydraulic experiment conducted by Liu et al (1957) in a laboratory flume with a pair of bridge abutments and a deck. The flow conditions were similar to orifice flow due to the high blockage ratio caused by the abutments and the deck. When modelling bridges in 2D, the contraction/expansion losses caused by the abutments would be handled explicitly by the 2D solver, so a value 1.56 can lead to duplication of the contraction/expansion losses caused by the bridge abutments.
TUFLOW 2D Bridge Setup
There are two methods available to model depth varying form loss of a bridge structure:
- The traditional method used to model depth-varying form loss through bridge components such as piers, decks, and rails.
- 2D BG Shape (2d_bg) (introduced in the 2023 release)
- A simplified approach developed to simplify the model input based on the findings from the joint TMR Study (Collecutt et al, 2022).
Both methods provide options for representing flow surcharging, the pressure flow of bridge decks and eventually submerged bridge flow at higher water levels. During the surcharging of bridge decks, higher energy losses can be specified to simulate the pressure flow.
Examples for how to configure both approaches are provided in the 2D structures section of the TUFLOW Wiki Example Models and Tutorial Module 4 - 2D Bridges.
2D Layered Flow Constriction (2d_lfcsh)
Four flow constriction layers are represented in a 2d_lfcsh layer. The lower three layers represents the pier, the bridge deck and the rails. Each layer has its own attributes to specify the blockage and the form loss coefficient. The top (fourth) layer assumes the flow is unimpeded, representative of flow over the top of a bridge. Within the same shape, the invert of the bed, and thickness of each layer can vary in 3D.
The following table provides an overview for how to determine the blockage and form loss coefficient for each layer. Note that this is just an overview and additional guidelines may need to be considered.
| Layer | Description | Blockage (%) | Form Loss Coefficient (FLC) | Notes |
|---|---|---|---|---|
| 1 | Pier layer | ~5% (can be omitted if included in FLC) | Estimate using Pier Losses | Represents flow obstruction from piers beneath the bridge deck |
| 2 | Bridge deck | 100% | Use calibration data, if available, to determine FLC. If no calibration is available, estimate using hB/T vs FLC table |
Full blockage, no flow through the deck
If using the hB/T vs FLC table, it is recommended to enable the Method C Form Loss Approach |
| 3 | Bridge rails | 10% – 100% | Use calibration data, if available, to determine FLC. If no calibration data is available, combined FLC for Layers 2 and 3 should be estimated using the hB/T vs FLC table, where T = L2_Depth + (pBlockage × L3_Depth)
|
Blockage and FLC depends on rail type Sensitivity testing with 100% blockage is recommended due to potential for debris during flood If using the hB/T vs FLC table, it is recommended to enable the Method C Form Loss Approach |
| 4 | Above rails | 0% | 0 | Represents unimpeded overtopping flow |

Blockage
The 2d_lfcsh functions by adjusting the flow width and the form loss of 2D cell faces. The combined blockage across the 4 layers is calculated at each simulation timesteps:

where
yi is the actual depth of water in layer i
ytotal is the total water depth
Form Loss Approach
The combined form loss coefficient is determined using one of three methods. The form loss coefficient method can be specified either individually using the 2d_lfcsh “Shape_Options” attribute or globally using the .tcf command:
Layered FLC Default Approach == [ METHOD A | {METHOD B} | METHOD C | METHOD D]
- METHOD A: The losses are accumulated as the water level rises through the layers.
- Layer 1: Constant form loss (L1_FLC)
- Layers 2 & 3: Form loss increases based on the depth of water in layer 2 & 3; peak form loss at top of Layer 3
- Above Layer 3: Applies the full accumulated form loss continuously, even when overtopping begins (no reduction)
- Note: Simpler method but tends to overestimate losses when the structure is submerged or overtopped
- METHOD B (default): the losses are applied pro-rata according to the depth of water in each layer.
- Layer 1: Constant form loss (L1_FLC)
- Layers 2 & 3: Form loss increases based on the depth of water in layer 2 & 3; peak form loss at top of Layer 3
- Above Layer 3: Total form loss gradually reduces as water overtops the structure
- Note: Maintains backward compatibility but may underrepresent losses during pressurised or overtopped flows
- METHOD C (recommended): hybrid approach combining Method A and Method B.
- Layer 1: Constant form loss (L1_FLC)
- Layers 2 & 3: Gradual increase in form loss with water level, following Method A
- Above Layer 3: Total form loss gradually reduces as water overtops the structure, following Method B
- Note: Recommended method; aligns closest to CFD modelling results and TUFLOW HPC behaviour.
- METHOD D: Allows the modeller to control the depth at which the losses start to reduce when the flow transitions between pressure flow and drowned flow.
- This approach is the same used by the 2d_bg layer (introduced in the 2023-03 release). It is recommended to use the 2d_bg layer as it has the benefit of a simplified attribute table, for easier user input.
Form Loss Calibration Example - Iowa River Flood Study
In this study, a combined form loss coefficient of 0.35 was used to match observed head loss during slight overtopping of a bridge. The FLC values for each layer were adjusted to achieve the correct combined form loss. The table and plot show how each layer contributes to the total form loss and highlight the differences in calculated form loss between the three methods.
| Layer | Depth (m) | Blockage (%) | Method A | Method B | Method C | |||
|---|---|---|---|---|---|---|---|---|
| Layer FLC | Combined FLC | Layer FLC | Combined FLC | Layer FLC | Combined FLC | |||
| 1 | 5.0 | 5 | 0.07 | 0.07 | 0.07 | 0.07 | 0.07 | 0.07 |
| 2 | 1.5 | 100 | 0.15 | 0.22 | 1.05 | 0.30 | 0.15 | 0.22 |
| 3 | 1.0 | 50 | 0.13 | 0.35 | 0.70 | 0.35 | 0.13 | 0.35 |

2D BG Shape (2d_bg)
2D BG Shape is similar to the Layered Flow Constriction, but has several updates to simplify the input based on the findings from the joint study with TMR (Collecutt et al, 2022).
The following table provides an overview of how to determine the blockage and form loss coefficient for each layer. Note that this is just an overview and additional guidelines may need to be considered.
| Layer | Description | Blockage (%) | Form Loss Coefficient (FLC) | Notes |
|---|---|---|---|---|
| 1 | Pier layer | ~5% (can be omitted if included in FLC) | Estimate using Pier Losses | Represents flow obstruction from piers beneath the bridge deck |
| 2 | Bridge deck | 100% | The Super Structure (Super_S) is the bridge deck and rails layers combined. Use calibration data, if available, to determine FLC.
|
Full blockage, no flow through the deck |
| 3 | Bridge rails | 10% – 100% | Sensitivity testing with 100% blockage is recommended due to potential for debris during flood events | |
| 4 | Above rails | 0% | 0 | Represents unimpeded overtopping flow |

Inflection Point
Based on findings from the joint study (Collecutt et al, 2022), the head loss peaks when the water level is approximately 1.6*T above the bridge soffit, and decays slowly as the bridge becomes progressively drowned out. The 'SuperS_IPf' attribute (inflection point factor, default = 1.6) can be used to define the height of the inflection point. The solid portion of the rail layer is also added to the deck thickness to calculate the depth to the inflection point (DIP), i.e.:
Form Loss Approach
The form loss approach is similar to the FLC approach METHOD C, with L2/L3 replaced by a single super structure layer:
Form Loss Calibration Example - Iowa River Flood Study
This example uses the same bridge setup described in the 2D Layered Flow Constriction section, with the following parameters applied:
- SuperS_FLC = 0.28
- SuperS_Ipf = 1.6,
The Depth to Inflection Point (DIP) is calculated as 3.2m above the bridge soffit.
The table and figure below show how the form loss value varies with water depth.
| Layer | Depth (m) | Blockage (%) | Form Loss |
|---|---|---|---|
| Pier | 5.0 | 5 | 0.07 |
| Deck | 1.5 | 100 | 0.28 |
| Rail | 1.0 | 50 |

2D Bridges Line vs Polygon Layer
The form loss coefficient (FLC) is applied differently when using a line compared to a polygon for both 2d_lfcsh and 2d_bg inputs. The FLC is applied at cell sides (u and v faces) as this is where velocities are calculated.
For larger bridges that spread across multiple cells, it is recommended to use a polygon layer, which selects all u and v faces falling within the polygon.
2D Layered Flow Constriction (2d_lfcsh)
| Geometry | Line Type | Width Attribute | FLC Input | FLC Applied | Notes |
|---|---|---|---|---|---|
| Line | Thin | zero | Total form loss of the bridge | Applies the FLC to a single row of cell sides | This approach is cell size independent. It is the easiest setup and the preferred / recommended approach when using 2d_lfcsh. |
| Thick | between zero and 1.5 times the cell size | Total form loss of the bridge | FLC/2 applied to all sides of the selected cells | A cell is selected if the polyline intersects the cell crosshair. Caution should be taken when using a "thick" line, as changes in cell size can cause it to become a "wide" line. If this occurs, the FLC attribute may need to be recalculated to avoid overestimating or underestimating losses. | |
| Wide | larger than 1.5 times the cell size | Total form loss of the bridge (may need to be recalculated, see notes) |
FLC divided by number of cell sides in the direction of flow (number of cell sides in the direction of flow is calculated as line width divided by cell size) |
Polygon shapes are recommended if more than 3 rows of faces must be selected.. Caution should be taken when using a "wide" line. The cell size and alignment of the 2d_lfcsh line may result in selecting too many or too few cell faces in the direction of the flow. The FLC input may need to be recalculated to ensure FLC Applied multiplied by the number of cell sides in the direction of flow equates to the intended total form loss. | |
| Polygon | - | - | Total loss per unit length (meters or feet) in the direction of flow | FLC * cell size applied to all sides of selected cells |
2D Bridge (2d_bg)
| Geometry | Line Type | Width Attribute | FLC Input | FLC Applied | Notes |
|---|---|---|---|---|---|
| Line | Thin | zero | Total form loss of the bridge | Applies the FLC to a single row of cell sides. | This approach is cell size independent. |
| Thick | larger than zero | Total form loss of the bridge | FLC/2 applied to all sides of the selected cells | This approach is cell size independent. A cell is selected if the polyline intersects the cell crosshair. | |
| Wide | Not supported | – | – | BG polygon shapes are recommended if more than 3 rows of faces must be selected. | |
| Polygon | - | (used to automatically distribute the total FLC to the selected faces) | Total form loss of the bridge | FLC / Deck_Width * cell size applied to all sides of selected cells | For bridges modelled using a 2d_bg polygon the relative ratio of the bridge width to the 2D cell size should be 4 or greater. For more information on this see 2d_bg_R_Bridge_Configuration_Advice.pdf. |
The following diagrams demonstrate how the input FLC is applied for the four geometry options for 2d_lfcsh and 2d_bg layers:

It is good modelling practice to check the lfcsh_uvpt_check and bg_uvpt_check files to confirm the number of faces selected and the FLC values assigned. It is also strongly recommended to undertake a sensitivity analysis on the applied form losses in the model to check if it makes any difference to the results and/or double check against other methods (hand calculations, other software, CFD modelling), especially if the bridge is near an area of interest. If calibration data is available, this should be used to guide the form loss value specification.
Common Questions Answered (FAQ)
What blockage values should I use for bridge guard rails?
The blockage of bridge guard rails can be anything from 100% blocked (solid concrete rails) to 10% blocked (very open rails). In addition, the accumulation of debris during a flood can be substantial as shown in the image below. Sensitivity testing with 100% blockage is recommended.

How to conduct sensitivity test for 2D bridges?
General recommendations to cross-check the results are:
- Compare computed affluxes against desktop methods (e.g. Hydraulics of Bridge Waterways, 1978) and/or other software including CFD, especially for unusual bridge designs.
- Use any recorded flood marks or general observations from past events to check and calibrate FLC values.
- Conduct sensitivity testing by assessing the impact and influence of FLC values on your modelling objectives. The afflux resulting from the FLC values will be proportional to the velocity head, i.e. ∆h=FLC*(v^2/2g). As such, if velocities are low (e.g. 1 m/s), the results may not be overly sensitive to uncertainties in the FLC values. If completing a check using this equation for a long skew bridge it is best to calculate the total structure velocity from a PO line digitised in the same location as the bridge.
Finally, after completing sensitivity testing and understanding the range of uncertainty due to unknowns like the degree of blockage and influence of FLC values (e.g. +/-20%), you are in a position to discuss with your client how best to proceed. For example, if the modelling is to set planning levels for a development upstream then it may be appropriate to choose values on the higher side (higher FLC values and/or blockage assumptions), noting that the uncertainty may be amply covered by a regulatory freeboard. Conversely, if the development is on the downstream side the conservative approach would be to use the results at the lower end of your FLC/blockage values.

Should I use both FLC and blockage for layer one in 2D bridge layered flow constriction?
When applying FLC and blockage values to model obstructions such as piers, the following considerations need to be taken into account:
- The FLC value applies an energy loss along 1D channels or across 2D cell faces equivalent to FLC*V2/2g where V is the 1D channel velocity or the 2D cell face velocity.
- FLC values are often sourced from publications such as Hydraulics of Bridge Waterways or AustRoads (e.g. Kp chart for piers).
- If possible, establish whether the source of the FLC value is based on the approach velocity (the velocity in the absence of piers) or structure velocity (the velocity with area blocked out by the piers) noting that it often isn’t clear or stated.
- If it is the structure velocity, this is usually the velocity at the vena-contracta (point of greatest contraction within the entrance to the structure and therefore highest velocity) - see image below. Bluff or sharp-edged obstructions will have a much more pronounced vena-contracta, and therefore higher velocity compared with a round-edged obstruction.
- FLC values based on the approach velocity will be higher than those based on the structure velocity to achieve the same energy loss.
- Applying a blockage equivalent to the obstruction width will increase, usually very slightly, the velocity of the 1D channel or 2D cell face. This won’t be the vena-contracta velocity, but a velocity between the approach velocity and the vena-contracta velocity. A greater blockage will need to be applied to emulate the vena-contracta velocity.
- If the FLC source value is based on:
- The approach velocity then there is no need to apply a blockage value.
- The structure velocity then the blockage value should be applied noting that it may be appropriate to apply a larger blockage to take into account the vena-contracta.
- If it is not clear or unknown whether the FLC source value is based on the approach or structure velocity, the recommendation would be to apply the blockage in the interests of being slightly conservative on the upstream flood level calculation.
- For most minor obstructions such as bridge piers, the blockage is usually relatively small and whether included or not has a negligible or minor affect on flood levels compared with other factors such as the approach embankments and the bridge deck.
- Blockage from debris wrapped around piers can have a greater influence on the results than the effect of applying or not applying a blockage. Debris wrapped around piers can be accounted for in the FLC value calculated for the pier layer.
- As always, sensitivity testing with and without blockage and +/- the FLC value is highly recommended to understand their importance in regard to the broader modelling objectives and the effects of uncertainties in the input data, boundaries, other parameters such as Manning’s n values, and the accuracy of the numerical solution scheme (see Maximising the Accuracy of Hydraulic Models webinar).

Image showing the formation of the vena-contracta.
I don't see results that I expect when using 2d_lfcsh layer
The 2d_lfcsh layer is a versatile feature that was designed to model bridges in 2D, but can also be used for other applications like fences, buildings raised on pillars and so on. Some of the unexpected results could be:
- Water level going through the bridge deck in 2D map output.
- Water transiting through 100% blocked Layer 1, e.g. fences with solid base.
- SHMax.csv reporting values above the bridge deck when 2D map output reports water level lower than the top of the bridge deck.
TUFLOW is a 2D solution (not 3D), in the 2d_lfcsh layer the percent blockage and form loss coefficient applied to the cell faces is depth averaged across the entire cell face (across Layer 1, 2 and 3):
- For bridges, where Layer 2 has a 100% blockage applied, the minimum flow width factor of 0.001 (i.e. 0.1%) is used and is averaged with the Layer 1 blockage (based on the depth of the water). This may result in a water level being reported within or above the bridge deck, which would represent the pressure head.
- Layered flow constriction works by adjusting the flow area of the cell faces by any blockages to generate the correct depth averaged velocity at each face at which the form losses are applied as a fraction of the V2/2g kinetic energy. Calculating the correct velocity is critical for determining the losses as the losses are proportional to the velocity squared.
- For a layered flow constriction cell face the flow area cannot be zero above the invert of Layer 1 to avoid a divide by zero in the computations, therefore after applying blockages, a minimum depth averaged flow width factor of 0.001 (i.e. 0.1%) is applied, which will allow a very small amount of water to flow through.
- If this is unacceptable, and a 2d_lfcsh is intended to be 100% blocked, or even just Layer 1 100% blocked in the case of a fence with a solid base, then the preferred approach is to raise the ground elevation by setting the 2d_lfcsh invert attribute higher or using a 2d_zsh Z Shape modification (e.g. a breakline).

Can I model bridge piers explicitly in 2D using very small cells?
It isn't recommended to explicitly model bridge piers by blocking out the pier faces in TUFLOW, or in any hydraulic modelling software based on solving Shallow Water Equations(SWE). Due to the 3-dimentiality of the flow and turbulence around a pier, computational fluid dynamics (CFD) approach is often required to simulate the flow around piers explicitly. The wake turbulence behind a simple-shape pier can be resolved to some extent using extremely fine mesh in TUFLOW (see calibration example to a flume experiment in the webinar on Energy Losses at Structures), however the predictions for head losses show notable sensitivities to the mesh size, the mesh design, and the choice of turbulence model. The extremely fine mesh resolution also results in significantly higher computational costs.
Therefore, the safest and strongly recommended approach with regard to establishing head losses and consequently flood levels, is to model the effects of such obstructions with form loss coefficients (applied to selected mesh cells) that have been derived from physical testing. This approach has been shown to provide the most consistent results across various mesh resolutions. It also has the added benefit that, by avoiding small cells in the mesh, it will provide much more efficient run times for flow solvers.

The point of flow separation around an object has a major bearing on the drag coefficient and is not reliably reproduced by 2D or 3D software.
How to best convert flow constriction data (2d_fc or 2d_fcsh) into newer formats (2d_lfcsh or 2d_bg)?
The form loss parameters can be transferred from the flow constriction (2d_fc or 2d_fcsh) to the first layer of the layered flow constriction (2d_lfcsh) or pier layer of the 2d_bg. Definition of the remaining form loss and blockage layer inputs should follow the guidance outlined in 2D Layered Flow Constriction and 2D BG Shape paragraphs.
When using floating pontoon (type FD in the 2d_fc or 2d_fcsh) different setup might need to be used for different events. For large events when floating pontoon becomes fixed at the top of the supporting piles, standard 2d_lfcsh setup can be used. Smaller events when the pontoon is floating at different heights might require more sensitivity testing of the structure parameters to find out a setup the matches the reality as close as possible.
Should I model bridges in 1D or 2D Domain?
The recommended approach typically depends on the study objectives and if the channel upstream and downstream of the bridge is modelled in 1D or 2D. To preserve the momentum as accurately as possible the bridge should be modelled in the same dimension as the channel, e.g. 1d_nwk bridge if the channels is in 1D and 2d_bg or 2d_lfcsh if the channel is modelled in 2D.
In 2D, the expansion/contraction losses are modelled based on the topography and don't need to be estimated as attributes as for 1D modelling. Also, for higher flows where the bridge is overtopped, 2D is preferable approach.
What is the difference between downstream and upstream controlled flow?
Downstream control means a change in downstream water level will cause a change in upstream water level. Upstream control means the upstream water level is insensitive to the downstream water level and usually indicates the occurrence of supercritical flow.
What FLC values should be used for 2d_bg bridge if hB/T is below 2 or above 6?
TMR has extended the CFD simulation to hB/T ratios of 1 to 10. Refer to the TUFLOW Manual for details.
If hB/T is outside this ratio:
- hB/T ratios of less than 1 represent a very unusual bridge sitting low to the ground, and the peak FLC may increase above the end value (FLC of 0.6) in a way that doesn't follow the research trend or extrapolation. For these cases we would recommend using CFD modelling to obtain a more informed value. Alternatively, computing an FLC based on pressure flow or using 1D culvert might be considered.
- For hB/T ratios of greater than 10, the FLC is likely to continue to decrease, but probably not significantly. Clamping to the end value (FLC of 0.16) might be considered the more conservative approach (if the primary concern is flood levels upstream of the bridge).
| Up |
|---|