Ensight Point Time Series Plot: Difference between revisions
Jump to navigation
Jump to search
Content deleted Content added
Chris Huxley (talk | contribs) No edit summary |
Chris Huxley (talk | contribs) No edit summary |
||
| (5 intermediate revisions by the same user not shown) | |||
| Line 3: | Line 3: | ||
* Select the clip line icon <br> |
* Select the clip line icon <br> |
||
[[File:Ensight_016.JPG]] |
[[File:Ensight_016.JPG]] |
||
* Relocate the clip line. Selecting the |
* Relocate the clip line. Selecting the center of the clip line is used to shift its location. Selecting the start or end of the line can be used to alter the line extent. Various right click options are also available that can be used for controlling the location and length of the line.<br> |
||
[[File: |
[[File:Ensight_032.png|450px]] |
||
* Select the parent Part ''2D TUFLOW Elements'' |
* Select the parent Part ''2D TUFLOW Elements'' |
||
* Right Click >> Create >> Clips |
* Right Click >> Create >> Clips |
||
| Line 26: | Line 26: | ||
[[File:Ensight_028.png|350px]] |
[[File:Ensight_028.png|350px]] |
||
*This dataset will be added to the Plots/Queries window, and also to the display window as a graph. Double click the graph in the display window to update the graph display options (colors, labels, titles etc.). |
*This dataset will be added to the Plots/Queries window, and also to the display window as a graph. Double click the graph in the display window to update the graph display options (colors, labels, titles etc.). |
||
[[File:Ensight_029.png| |
[[File:Ensight_029.png|450px]]<br> |
||
* Plot data can be managed from the Plot/Queries window. For example, new plots can be added by right clicking the query dataset ''Right Click >> Add to new plot'' <br> |
* Plot data can be managed from the Plot/Queries window. For example, new plots can be added by right clicking the query dataset: ''Right Click >> Add to new plot'' <br> |
||
[[File:Ensight_030.png| |
[[File:Ensight_030.png|600px]]<br> |
||
* Graphs can either be displayed |
* Graphs can either be displayed or turned off, via selecting or deselecting the ''Show'' checkbox within the Plots/Queries window. |
||
[[File:Ensight_031.png|450px]]<br> |
[[File:Ensight_031.png|450px]]<br> |
||
Latest revision as of 09:17, 18 February 2015
Create a clip line in the location where you would like to extract results.
- Select the clip line icon
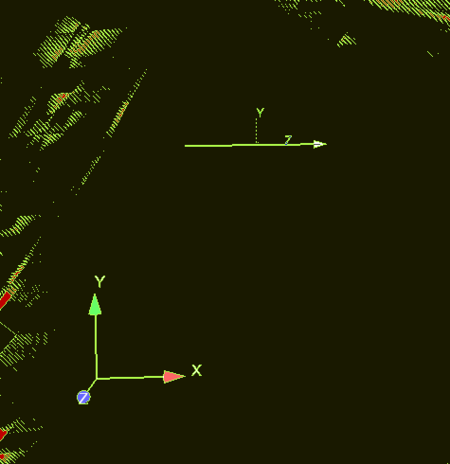
- Relocate the clip line. Selecting the center of the clip line is used to shift its location. Selecting the start or end of the line can be used to alter the line extent. Various right click options are also available that can be used for controlling the location and length of the line.
- Select the parent Part 2D TUFLOW Elements
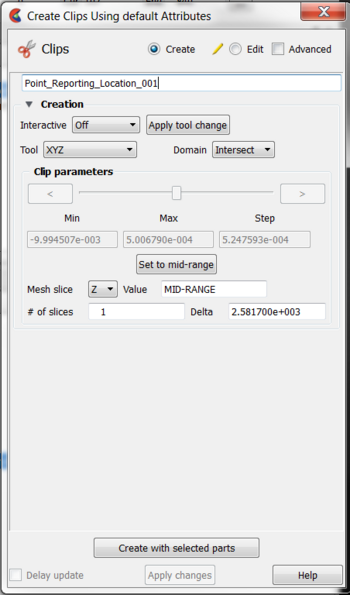
- Right Click >> Create >> Clips
- Name the Clip, for example Point_reporting_Location_001.
- Select Tool = XYZ
- Select Mesh Slice = Z
- Select Value = MID-RANGE
- Deselect the clip line tool.
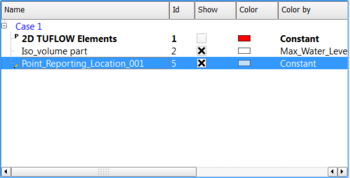
- The clip should now remain within the view window and also show in the list of Parts
Variables need to be associated with the clip:
- Select the clip part (left click the Part)
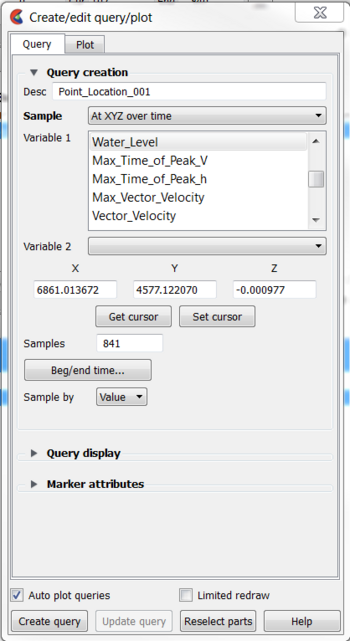
- Select query
- Select Sample = At XYZ over time
- Select the desired variable. For example Depth or Water_Level
- Select Auto plot queries to include the graph dataset within an existing plot window. Deselect Auto plot queries to display the graph as an independent dataset.
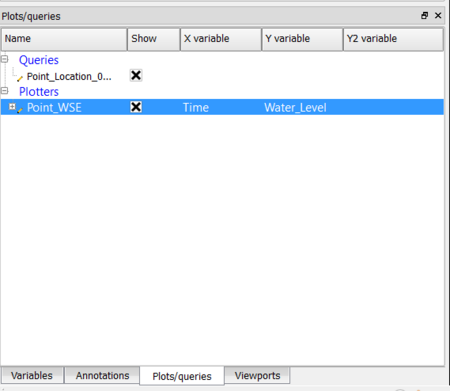
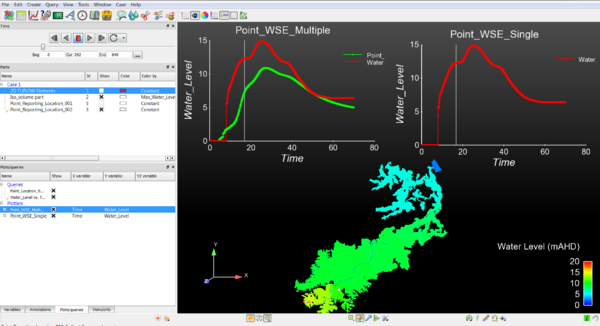
- This dataset will be added to the Plots/Queries window, and also to the display window as a graph. Double click the graph in the display window to update the graph display options (colors, labels, titles etc.).
- Plot data can be managed from the Plot/Queries window. For example, new plots can be added by right clicking the query dataset: Right Click >> Add to new plot
- Graphs can either be displayed or turned off, via selecting or deselecting the Show checkbox within the Plots/Queries window.
| Up |
|---|
