Check Files 1d ta tables: Difference between revisions
mNo edit summary |
No edit summary |
||
| (2 intermediate revisions by the same user not shown) | |||
| Line 5: | Line 5: | ||
* The processed hydraulic properties with elevation. This includes the width, area, wetted perimeter, hydraulic radius and conveyance. This can be seen in the area highlighted in blue in the image below. |
* The processed hydraulic properties with elevation. This includes the width, area, wetted perimeter, hydraulic radius and conveyance. This can be seen in the area highlighted in blue in the image below. |
||
<br> |
<br> |
||
[[File: |
[[File:1d_ta_tables_check_01a.png]] |
||
<br><br> |
<br><br> |
||
For any interpolated cross-sections the interpolated properties are output to the 1d_ta_tables check file, this occurs at the end of the file after the input data (see above) has been output. If using end cross-sections, this contains the interpolated sections that are applied at the channel centre. See the TUFLOW |
For any interpolated cross-sections the interpolated properties are output to the 1d_ta_tables check file, this occurs at the end of the file after the input data (see above) has been output. If using end cross-sections, this contains the interpolated sections that are applied at the channel centre. See the <u>[https://docs.tuflow.com/classic-hpc/manual/latest/ TUFLOW Manual]</u> for more information on end and centre snapped cross-sections.<br> |
||
<br> |
<br> |
||
[[File: |
[[File:1d_ta_tables_check_02a.png]] |
||
<br> |
<br><br> |
||
This file contains not only information on cross-sections but on all data read in using the <font color="blue"><tt>Read GIS Table Links </tt></font> <font color="red"><tt>==</tt></font><tt> <gis file></tt>. |
This file contains not only information on cross-sections, but on all data read in using the <font color="blue"><tt>Read GIS Table Links </tt></font> <font color="red"><tt>==</tt></font><tt> <gis file></tt>. For example, this may also include bridge loss tables or nodal area tables as per the below:<br> |
||
<br> |
<br> |
||
[[File:Check Files 1d ta tables 03.jpg]] |
[[File:Check Files 1d ta tables 03.jpg]] |
||
<br><br> |
|||
{{Tips Navigation |
|||
|uplink=[[TUFLOW_Check_Files | TUFLOW Check Files]] |
|||
}} |
|||
Latest revision as of 12:08, 5 January 2026
The 1d_ta_tables check files is a .csv format file which contains information about the tabular data input to the 1D model. This contains information on the cross-section profiles, cross-section hydraulic parameters, nodal surface areas and bridge loss coefficients. This is data that has been input to the TUFLOW model using the Read GIS Table Links == <gis file> command.
For each cross-section the following is output:
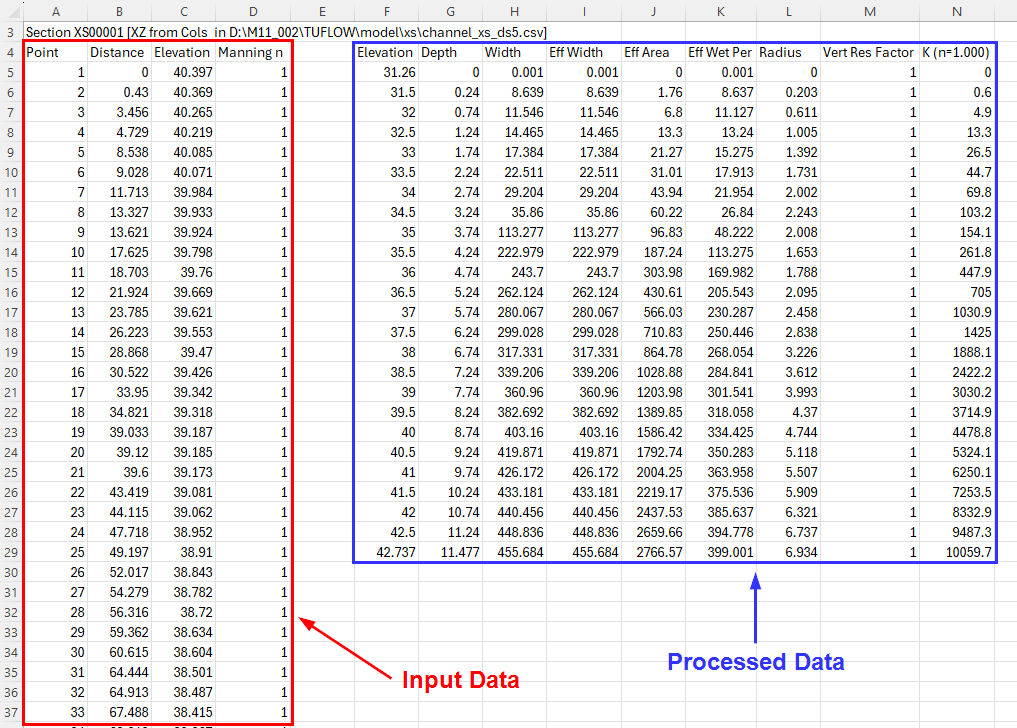
- The source .csv file, this is the top line in the image below.
- Raw input data is output to the 1d_ta_tables check file. This can be seen in the area highlighted in red in the image below.
- The processed hydraulic properties with elevation. This includes the width, area, wetted perimeter, hydraulic radius and conveyance. This can be seen in the area highlighted in blue in the image below.

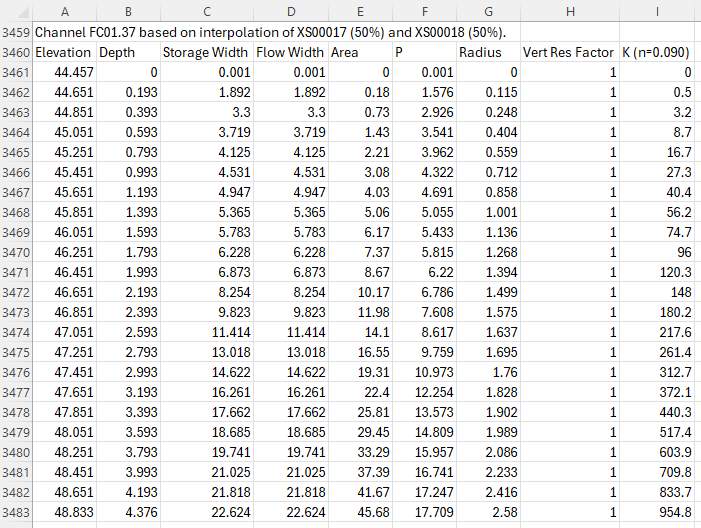
For any interpolated cross-sections the interpolated properties are output to the 1d_ta_tables check file, this occurs at the end of the file after the input data (see above) has been output. If using end cross-sections, this contains the interpolated sections that are applied at the channel centre. See the TUFLOW Manual for more information on end and centre snapped cross-sections.

This file contains not only information on cross-sections, but on all data read in using the Read GIS Table Links == <gis file>. For example, this may also include bridge loss tables or nodal area tables as per the below:

| Up |
|---|