TUFLOW 2D Cell Size Selection: Difference between revisions
Chris Huxley (talk | contribs) |
Chris Huxley (talk | contribs) |
||
| Line 32: | Line 32: | ||
This Wiki page uses two test cases to discuss this topic. Quantitative results are presented demonstrating how and when resolution assumptions have a tangible impact on model results. |
This Wiki page uses two test cases to discuss this topic. Quantitative results are presented demonstrating how and when resolution assumptions have a tangible impact on model results. |
||
= Test Case 1 = |
= Test Case 1 - Rural Dam Break = |
||
This test case has been sourced from the <u>[https://www.tuflow.com/Download/Publications/UK%20EA%202D%20Benchmarking%20Results.TUFLOW%20Products%202017-09.pdf UK Environment Agency 2D Hydraulic Model Benchmark Test dataset]</u>. It is referred to as Test 5 in the Environment Agency (EA) dataset. The EA designed to simulate flood wave propagation down a river valley following the failure of a dam. The valley DEM is ~0.8 km by ~17 km and the valley slopes downstream on a slope of ~0.01 in its upper region, easing to ~0.001 at lower elevations. The model uses a single manning n value of 0.04 across the entire domain. |
This test case has been sourced from the <u>[https://www.tuflow.com/Download/Publications/UK%20EA%202D%20Benchmarking%20Results.TUFLOW%20Products%202017-09.pdf UK Environment Agency 2D Hydraulic Model Benchmark Test dataset]</u>. It is referred to as Test 5 in the Environment Agency (EA) dataset. The EA designed to simulate flood wave propagation down a river valley following the failure of a dam. The valley DEM is ~0.8 km by ~17 km and the valley slopes downstream on a slope of ~0.01 in its upper region, easing to ~0.001 at lower elevations. The model uses a single manning n value of 0.04 across the entire domain. |
||
The model topography, EA reporting points and the simulation inflow hydrograph is shown below. <br> |
The model topography, EA reporting points and the simulation inflow hydrograph is shown below. <br> |
||
Revision as of 14:31, 16 August 2018
This page is currently under construction.
Introduction
This page of the TUFLOW Wiki discusses 2D cell size convergence. Cell size convergence refers to the tendency for model results to trend towards a common answer as cell size decreases. This behaviour occurs due to topographic features that influence the hydraulic flow behaviour better approximating reality as resolution increases. The series of creek cross-section images below demonstrate this. As model resolution increases from 20m to 5m the modelled topography progressively matches the real-world geometry more closely.

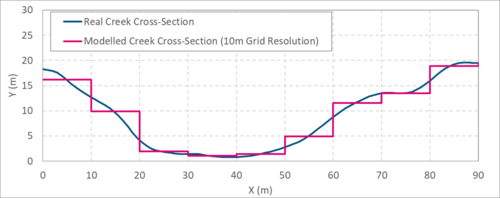

Unfortunately it isn't practical for all models to be designed at an infinitely fine resolution due to the cost it has on simulation speed. Increasing a model resolution will make a simulation run slower. As a rule of thumb, halving the cell size in a model will typically increase the simulation run time by a factor 8. This is due to the number of cells increasing by a factor of (4) four and the necessity for a calculation timestep half that of the larger resolution, translating to (2) twice the number of calculations (4 x 2 = 8). The challenge for modellers is knowing what resolution is necessary to achieve results that are fit for purpose with sufficient accuracy.
Australian Rainfall and Runoff Guideline - Two Dimensional Modelling in Urban and Rural Floodplain provides some recommendations on this topic. It states:
- The resolution of a 2D model grid/mesh determines the scale of physical features and flow behaviour that can be modelled for a given study area. Selection of an appropriate resolution is generally driven by a combination of the following factors:
- * The scale of topographic and/or flow phenomena to be modelled
- * The desired level of detail to be achieved in the model outputs
- * The length of event time and consequent run time
- * The size of the area of interest
- Details of the model schematisation process including resolution aspects are described in Chapter 6. Chapter 7 also highlights the importance of grid/mesh resolutions in achieving manageable run times to maximise calibration outcomes. Table 10-2 (below) provides guidance on levels of model resolution that may be appropriate in certain typical situations.
| Modelling Case | Typical 2D Cell Resolution |
| Flow in Channel | In order to adequately resolve flow in a channel it is desirable to provide at least 5 grid/mesh elements laterally across the channel |
| Urban Overland | Most urban flood models employ grid/mesh resolutions of 2m to 5m. |
| Flow in Floodplain | Rural floodplain models typically employ grid/mesh resolutions of 10m and 50m (although resolutions up to 200m have been used) depending on the size of the are to be analysed, the characteristics/dimensions of the floodplain and the desired level of output detail. |
| Lakes and Estuaries | these situations often include areas of open water where less detail is required than along the water body boundary. Such situations are well suited to a flexible mesh rather than fixed grid based model as the mesh is able to incorporate a change of resolution across the model domain. element resolutions for these models can span the full range as described above depending on project requirements. |
| Flow Over and Embankment | Embankments effectively act as weirs in the floodplain context. Many 2D modelling packages have automatic or manually activated corrections that compensate for the error in head loss typically associated with modelling broad-crested weir flow with a 2D scheme. For practical purposes, a single 2D element is generally adequate to represent the impact of a levee, road or railway embankment. The resolution of these elements is generally not a significant limitation on the schematisation of most domains. |
This Wiki page uses two test cases to discuss this topic. Quantitative results are presented demonstrating how and when resolution assumptions have a tangible impact on model results.
Test Case 1 - Rural Dam Break
This test case has been sourced from the UK Environment Agency 2D Hydraulic Model Benchmark Test dataset. It is referred to as Test 5 in the Environment Agency (EA) dataset. The EA designed to simulate flood wave propagation down a river valley following the failure of a dam. The valley DEM is ~0.8 km by ~17 km and the valley slopes downstream on a slope of ~0.01 in its upper region, easing to ~0.001 at lower elevations. The model uses a single manning n value of 0.04 across the entire domain.
The model topography, EA reporting points and the simulation inflow hydrograph is shown below.


The model has a single inflow at the top of the catchment.

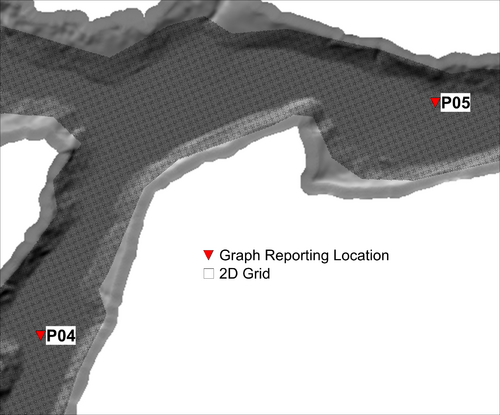
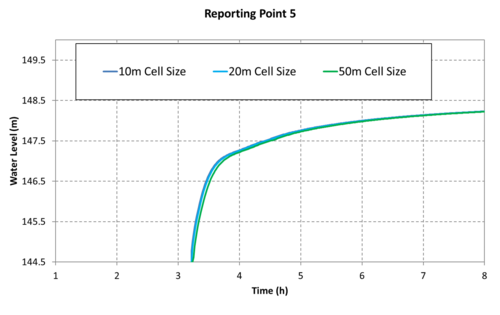
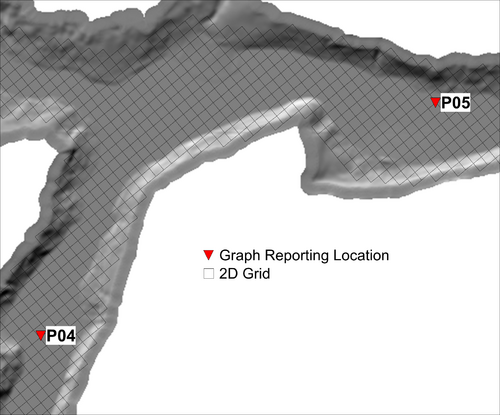
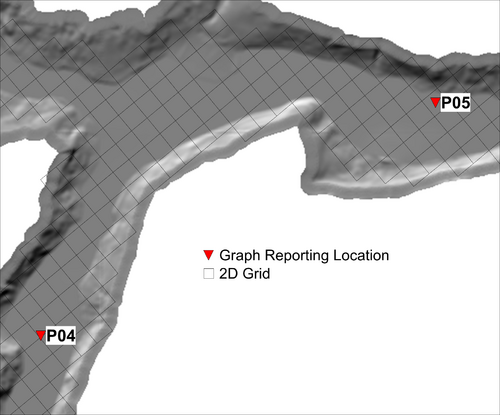
The water flows downhill through the respective EA reporting points. Reporting location 4 and 5 are at the bottom of the model, furthest from the inflow locations.
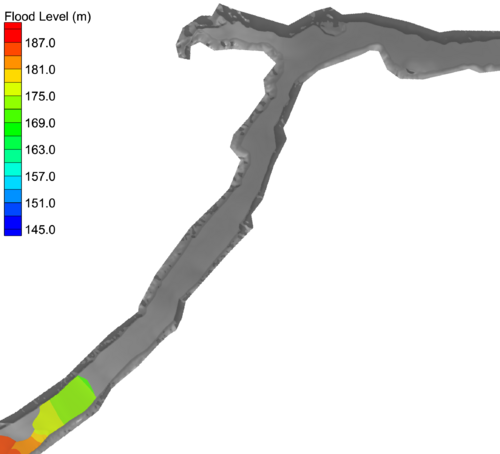
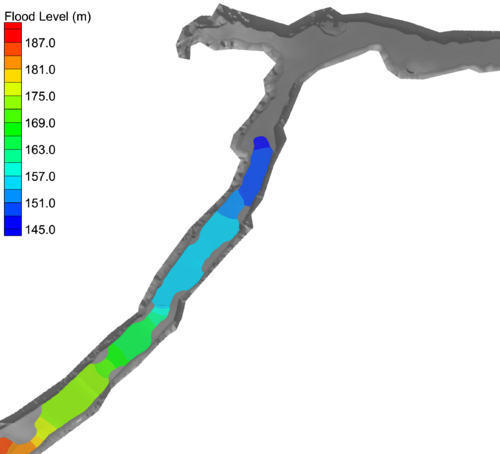
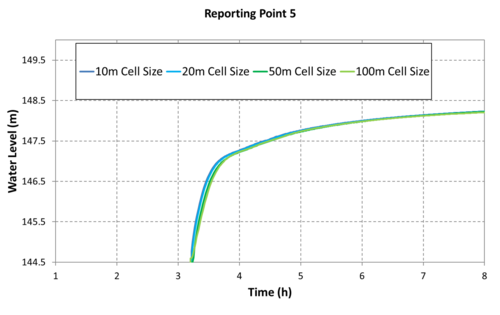
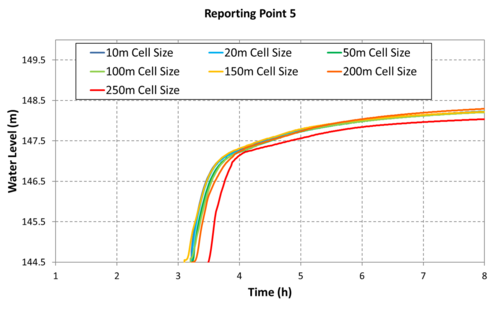
The EA benchmark testing original assumed a 50m cell resolution. For the purpose of this assessment a range of cell sizes have been used to determine the impact changing grid resolution has on the model result. The following grid resolutions were used:
- 10m (33ft) resolution - 188,240 cell count
- 20m (66ft) resolution - 47,080 cell count
- 50m (164ft) resolution - 7,540 cell count
- 100m (328ft) resolution - 1,880 cell count
- 150m (492ft) resolution - 840 cell count
- 200m (656ft) resolution - 480 cell count
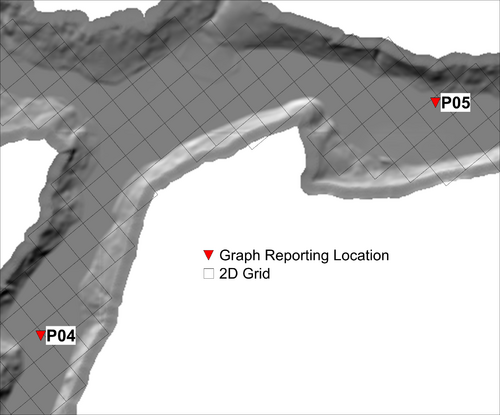
- 250m (820ft) resolution - 300 cell count
Test Case 1 - Results
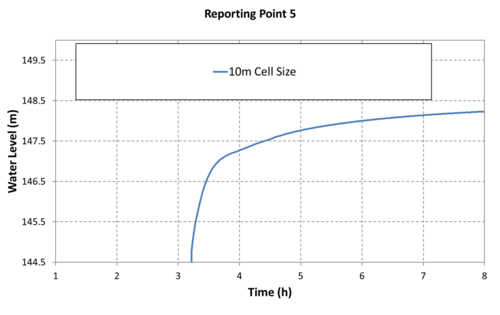
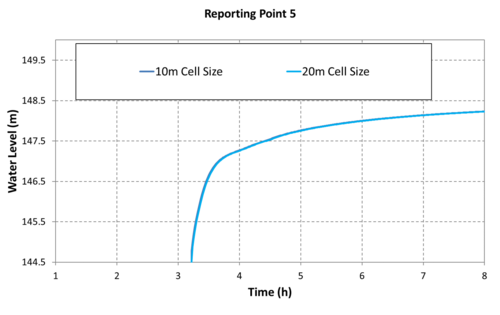
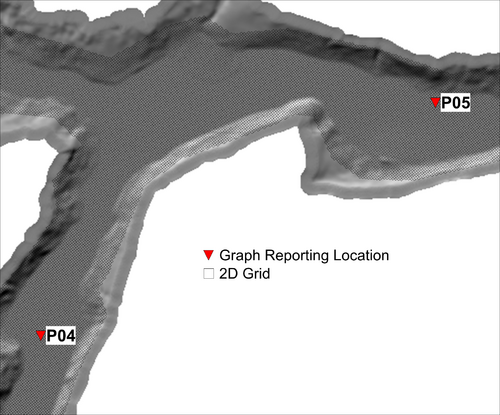
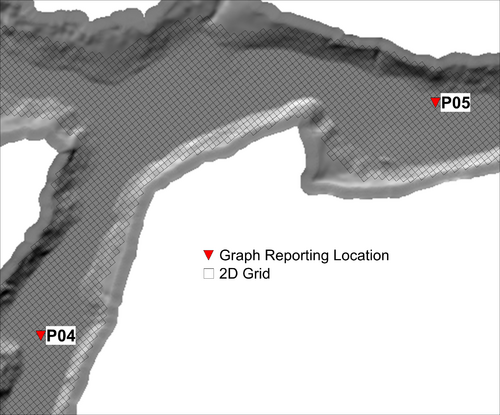
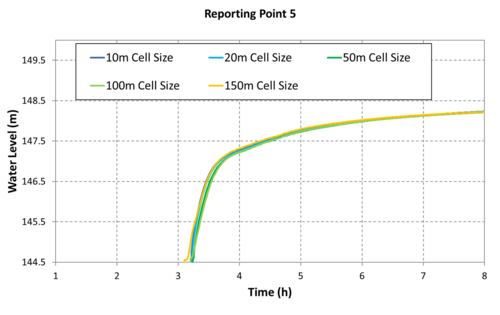
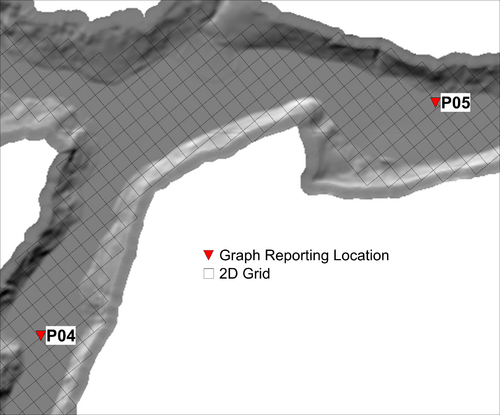
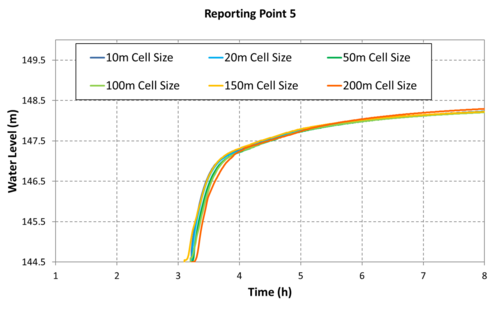
Test results have focused on reporting locations 4 and 5. Their location furthest downstream makes them most sensitive of all 7 reporting points. Any divergence in result due to poor representation of the upstream topography will accumulate, amplifying the result difference associated with a change in cell resolution. The results are presented below. Although the figures are shown in sequence (from fine to coarse resolution), the results are overlayed on one another moving through the dataset so it obvious if poor convergence occurs.
| Cell Size | Location 4 Result | Location 5 Result | Mesh Resolution Figure |
| 10m | 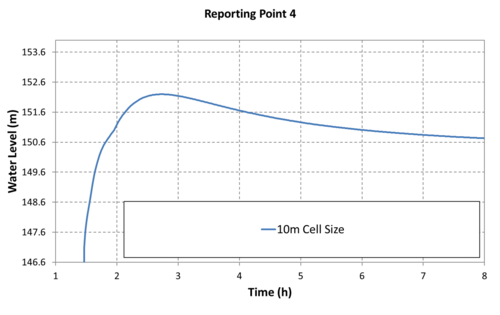 |
 |
|
| 20m | 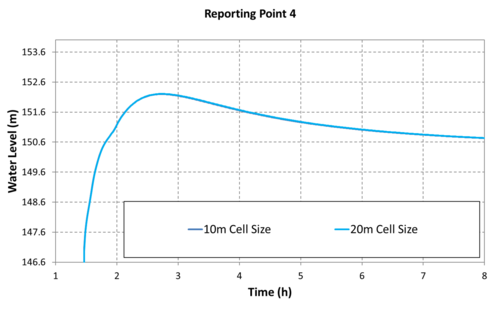 |
 |
|
| 50m | 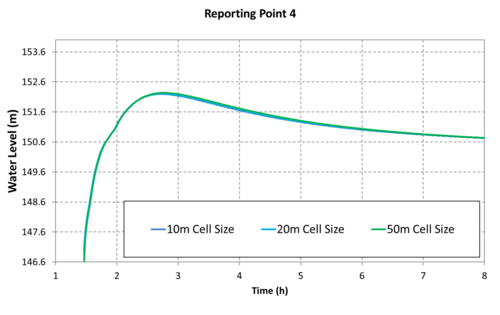 |
 |
|
| 100m | 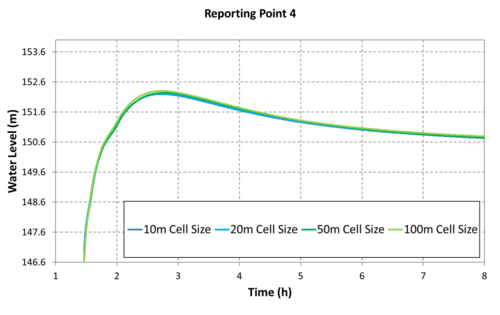 |
 |
|
| 150m | 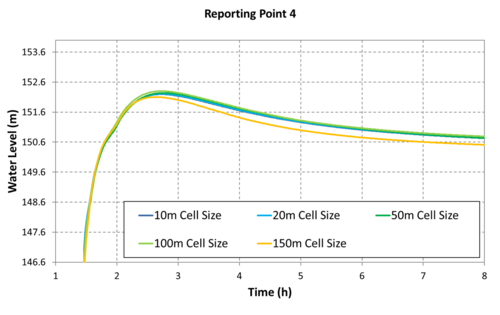 |
 |
|
| 200m | 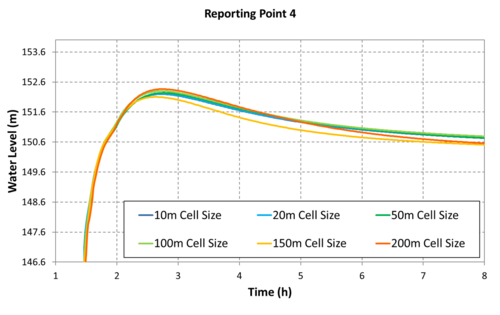 |
 |
|
| 250m | 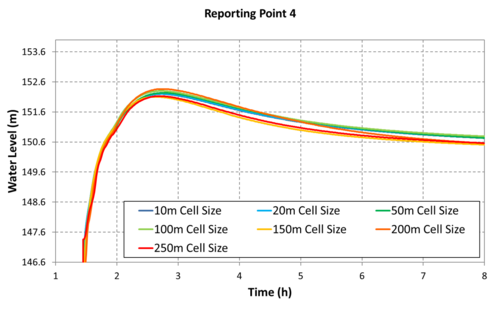 |
 |
|