TUFLOW Viewer Matplotlib v3.5.1 Bug: Difference between revisions
Ellis Symons (talk | contribs) No edit summary |
Ellis Symons (talk | contribs) No edit summary |
||
| Line 26: | Line 26: | ||
===Potential Workarounds=== |
===Potential Workarounds=== |
||
Users can potentially workaround this bug by ensuring that the order of the labels in the selection box within the customise options dialog stays the same. Or alternatively, the error only occurs if the user re-enters the customise dialog (as demonstrated by the example above). |
Users can potentially workaround this bug by ensuring that the order of the labels in the selection box within the customise options dialog stays the same. Or alternatively, the error only occurs if the user re-enters the customise dialog after changing the labels (as demonstrated by the example above) so the user can update the plot labels without scrambling the dataset if they only edit the labels once.<Br> |
||
<Br> |
|||
{{Tips Navigation |
|||
|uplink=[[TUFLOW_Viewer#Loading_Results| Back to TUFLOW Viewer Main Page]] |
|||
}} |
|||
Revision as of 03:16, 7 April 2022
Matplotlib is the Python plotting library used by TUFLOW Viewer. We have found a bug in version v3.5.1 of this library that can mix up the plotting datasets being displayed in the plot window if the user makes an update to the dataset labelling in a certain way. More information on the bug is given below. The Matplotlib library version installed in QGIS is controlled by the QGIS distribution and not something we have control over. As of writing this page, the latest, and only version, this seems to affect is QGIS 3.24. It may persist into future releases of QGIS if the bug is not fixed in the Matplotlib library, or if it is fixed then it must also be updated in the QGIS distribution.
More About The Bug
The bug is triggered when the order of the datasets, determined by the dataset labels, is changed when the user customises the plot. The order is determined alphabetically, but all capitilised letters take precedence over lowercase i.e. it goes in the following order of A-Z then a-z.
Example
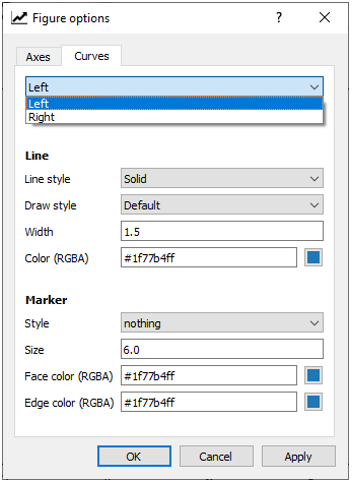
Say we have 2 datasets called 'Left' and 'Right' as shown below which are simple vertical lines being plotted. The 'Left' dataset is on the left, and the 'Right' dataset is on the right.
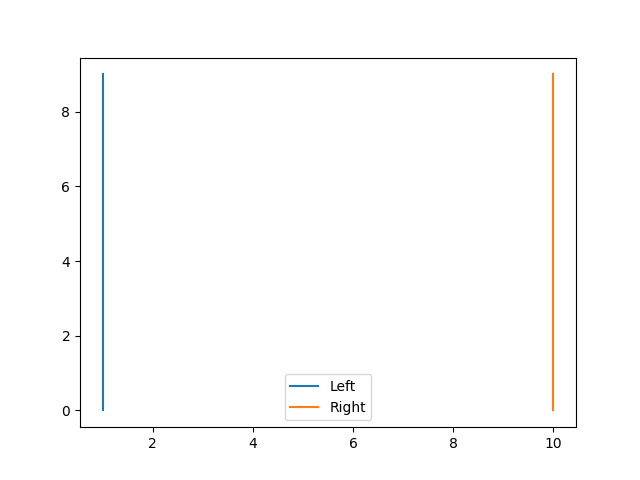
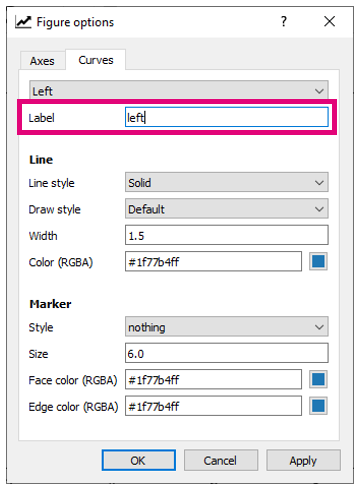
Now we'll customise the line names, and we'll simply rename 'Left' to 'left' with a lowercase 'L'. This will change the sorted order of the lines in the customise menu (as you'll see further below).
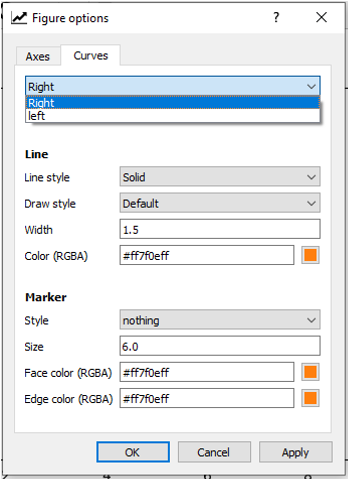
Looking at the new plot, it's still working for the time being. But if go back into the customise dialog we can see the order in the dropdown box has changed due to the renaming we did.
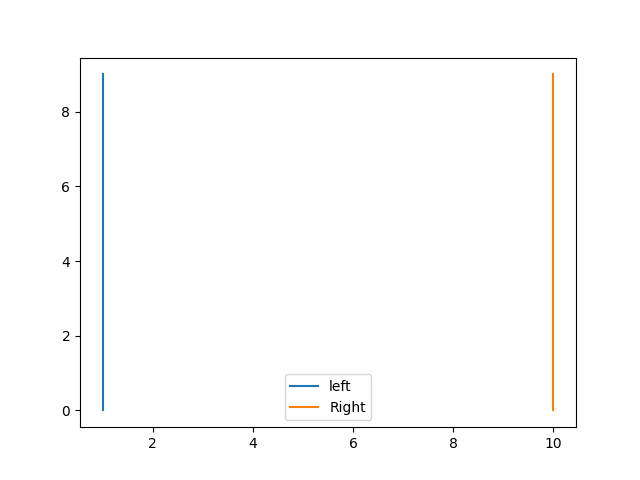
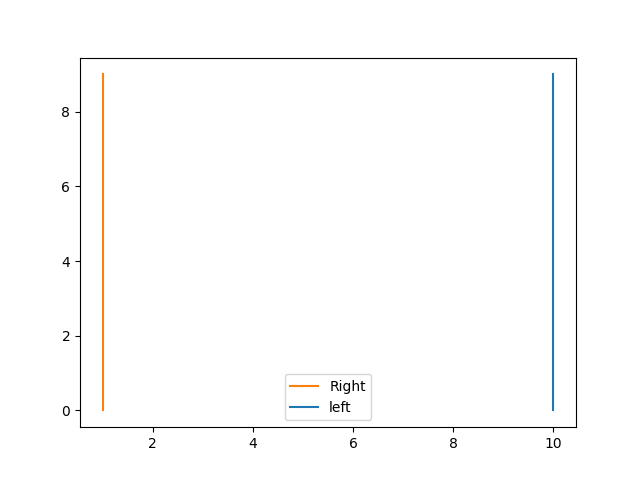
Now simply clicking ok with no actual changes we see the datasets have become scrambled.
Resetting the Plot
TUFLOW Viewer cannot correct the scrambling once it has occured since it relies on information from the artists themselves (which are now scrambled). However it can (in most cases) detect if the plot has become scrambled (or about to become srambled) and can stop the styles from being applied. Users will receive the following message if TUFLOW Viewer detects that the data is about to be scrambled:
Unfortunately once this has happened on any of the given plot windows, TUFLOW Viewer will give this message each time the user tries to customise the plot. To reset, the user should select the following under the TUFLOW Viewer menu Settings >> Reset Plotting Colours.
Potential Workarounds
Users can potentially workaround this bug by ensuring that the order of the labels in the selection box within the customise options dialog stays the same. Or alternatively, the error only occurs if the user re-enters the customise dialog after changing the labels (as demonstrated by the example above) so the user can update the plot labels without scrambling the dataset if they only edit the labels once.
| Up |
|---|
