Tutorial M10 002 Results QGIS: Difference between revisions
Jump to navigation
Jump to search
Content deleted Content added
Created page with "=Introduction= QGIS is used to view the bathymetry and water levels with the TUFLOW Viewer. For viewing of the 2D map results, see <u> Module 1<..." |
|||
| Line 21: | Line 21: | ||
:*A cross section of the dam wall was inspected showing the bathymetry changing over time. |
:*A cross section of the dam wall was inspected showing the bathymetry changing over time. |
||
:*Time series water level was inspected at the location of the water level trigger point. |
:*Time series water level was inspected at the location of the water level trigger point. |
||
:*For further functionality, see <u>[[TUFLOW_Viewer | TUFLOW Viewer]]</u>. |
|||
<br> |
<br> |
||
Revision as of 11:20, 13 April 2023
Introduction
QGIS is used to view the bathymetry and water levels with the TUFLOW Viewer. For viewing of the 2D map results, see Module 1.
Method
Inspect bathymetry and water level outputs:
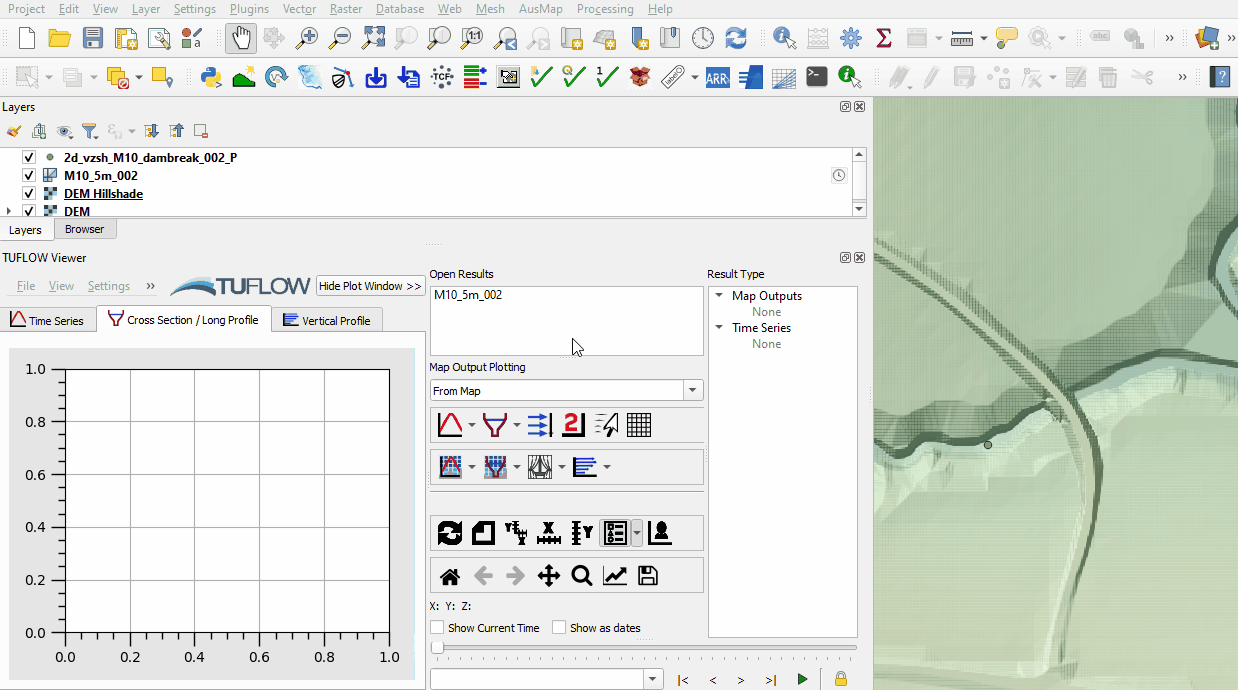
- Open the TUFLOW Viewer.
- Select File > Load Results. Navigate to the M10_5m_002.tcf in the Module_10\TUFLOW\runs folder and open it.
- Select the 'Bathymetry' output type in the Result Type panel. It shows elevations at cell corners (ZH points) over time based on the variable geometry (2d_vzsh).
- Use the Cross Section to plot the bathymetry and bed elevation (elevation at the beginning of the simulation) at the location of the dam break. The dam break is triggered by the water level at the point.
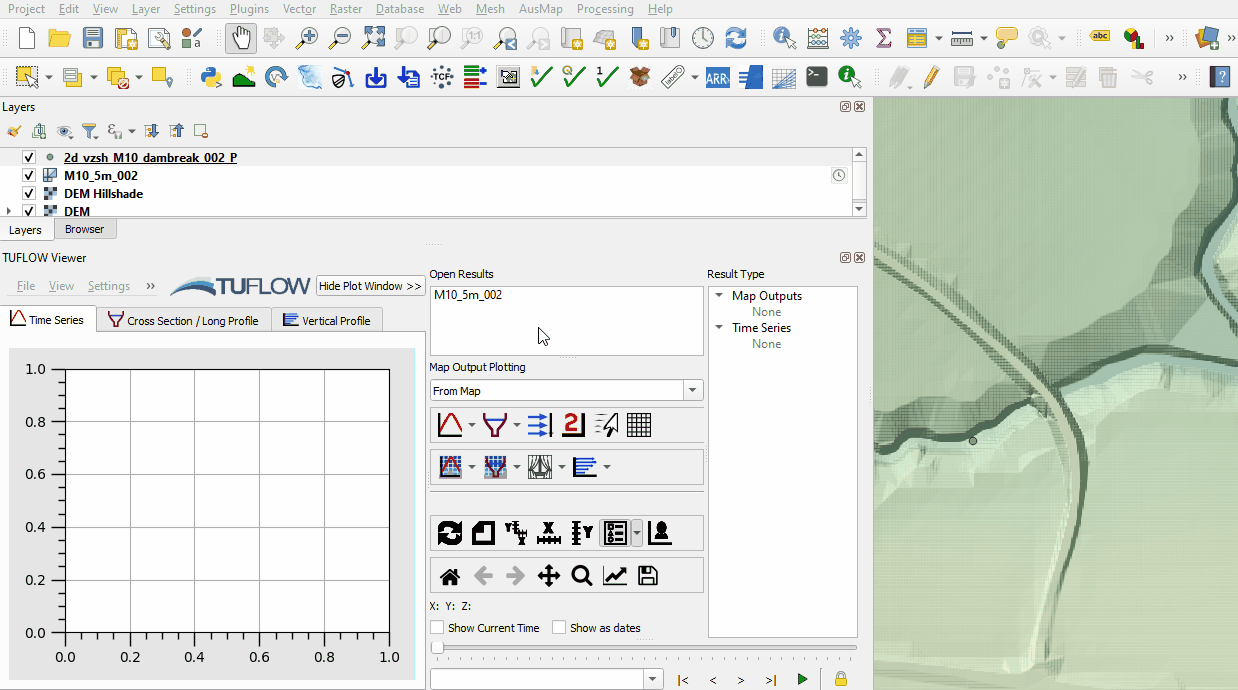
- Use the Plot Time Series tool to see the time series of the water level at the location of the water level trigger point from 2d_vzsh_M10_dambreak_002_P.shp. The dam break begins when the water level at the point reaches 60m:


Conclusion
- A cross section of the dam wall was inspected showing the bathymetry changing over time.
- Time series water level was inspected at the location of the water level trigger point.
- For further functionality, see TUFLOW Viewer.
| Up |
|---|