TUFLOW SWMM Tutorial M01: Difference between revisions
Chris Huxley (talk | contribs) |
Chris Huxley (talk | contribs) |
||
| Line 192: | Line 192: | ||
Plot time series results through the pipe network: |
Plot time series results through the pipe network: |
||
<ol> |
<ol> |
||
<li>Open |
<li>Open TUFLOW Viewer in the QGIS TUFLOW Plugin. |
||
<li>Select File > Load Results - Time Series. Navigate to the '''TS01_5m_001_swmm_ts.gpkg''' in the '''TUFLOW_SWMM_Module_01\TUFLOW\results''' folder and open it. |
<li>Select File > Load Results - Time Series. Navigate to the '''TS01_5m_001_swmm_ts.gpkg''' in the '''TUFLOW_SWMM_Module_01\TUFLOW\results''' folder and open it. |
||
<li>Two additional files appear in the Layers panel: |
<li>Two additional files appear in the Layers panel: |
||
Revision as of 16:13, 27 November 2023
Introduction
In this module, three culverts are added to represent flow through embankments that block the main creek flow path. EPA SWMM is used as the solution scheme for the 1D culvert flow calculations, dynamically linked with the TUFLOW HPC 2D solution scheme.
The GIS layers are:
- TSCF (TUFLOW SWMM Control File) layers:
- SWMM.inp: A text file containing a record of the SWMM culvert inputs and also SWMM simulation parameters.
- 1d_SWMM_Inlet: A layer used to define culvert inlet nodes.
- TBC layers:
- 2d_bc: A layer defining the locations of 1D/2D links.
TUFLOW SWMM Module 1 builds from the model created in TUFLOW Module 2 (in the TUFLOW Only tutorial dataset). The completed Module 2 model is provided in the TUFLOW_SWMM_Module_01\TUFLOW folder of the download dataset as the starting point for this tutorial
SWMM Inputs and 1D/2D Linking
Create SWMM GeoPackage Spatial Database
- Create a new folder in the TUFLOW_SWMM_Module_01\TUFLOW\model folder called swmm. This is the location where all SWMM inputs will be saved.
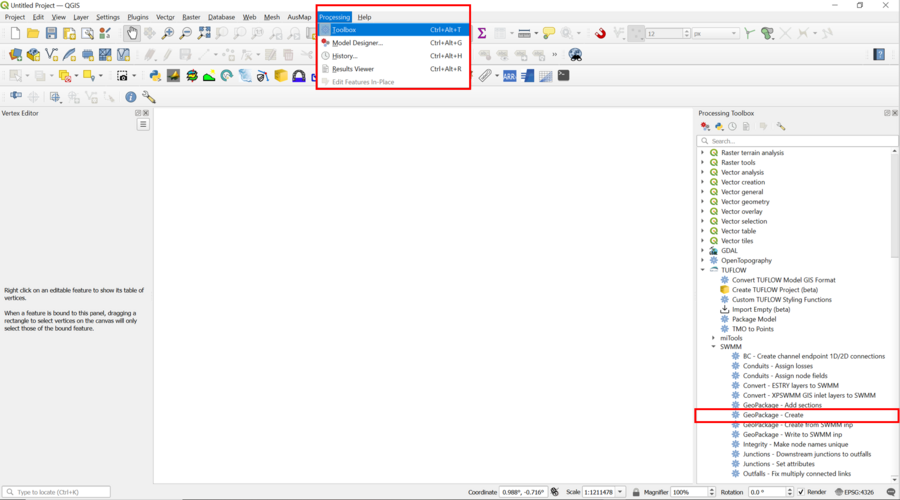
- Open QGIS and select Processing >> Toolbox from the top drop menu options to open the Processing Toolbox panel.
- From the TUFLOW >> SWMM processing tool list, select GeoPackage-Create.
- Within the GeoPackage-Create options, set the following:
- CRS for GeoPackage = Project CRS: EPSG:32760 - WGS 84/UTM zone 60S
- Initial SWMM Sections, click on the ... button, then select: Title, Options, Nodes-Junctions, Nodes-Outfalls, Links-Conduits, Streets, Inlets, Report
- GPKG file name to create, click on the ... button, select Save to File.... Navigate to the newly created swmm folder and set the SWMM GeoPackage Spatial Database name to TS01_001.gpkg
- Select Run. After the processing task is complete, select Close.
- Open the new SWMM GeoPackage Spatial Database in QGIS by dragging and dropping swmm\TS01_001.gpkg from Windows Explorer into QGIS. When prompted by QGIS select "Add Layers" to open all vectors within the GeoPackage database. By default, all items in the available list should have been selected.

<< Add video of above steps - when you create the vid ask me about the select CRS option. I want a specific workflow used so it captures something I didn't find intuitive>>
GIS Data Entry
Navigate to the TUFLOW_SWMM_Module_01\Tutorial_Data folder in Windows Explorer. Drag and drop SWMM_Culverts.gpkg into QGIS to open the file. SWMM_Culverts.gpkg includes three Layers, Links-Conduits, Nodes-Junctions and Nodes-Outfall. Links-Conduits defines the culvert location, type and geometry. Nodes-Junction define the upstream culverts inverts. Nodes-Outfall define the downstream culvert inverts.
Complete the following steps:
- Copy the objects from Links--Conduits SWMM_Culverts.gpkg into Links--Conduits TS01_001.gpkg. Steps to Copy/Paste are as follows:
- Left click Links--Conduits SWMM_Culverts.gpkg in the QGIS Layers Panel. Right cick the Layer and select Zoom to Layer if the three objects within the layer are currently not displayed in the main Map Window.
- Use the select the Feature by Area tool to select all items included in Links--Conduits SWMM_Culverts.gpkg
- Select Edit >> Copy Features
- Left click Links--Conduits TS01_001.gpkg in the QGIS Layers Panel.
- Select Toggle Editing to enable changes to be made to the Layer.
- Select Edit >> Paste Features
<< Add video for Copy Paste>
- Copy the objects from Nodes--Junction SWMM_Culverts.gpkg into Nodes--Junction TS01_001.gpkg. Junctions are considered inlets, and should be defined at the upstream end of culverts.
- Copy the objects from Nodes--Outfall SWMM_Culverts.gpkg into Nodes--Outfall TS01_001.gpkg. Outfalls are treated as outlets, and are required at the downstream end of culverts.
- Close SWMM_Culverts.gpkg
- Inspect the attribute information within the respective layers to familiarize yourself with the data.
<< Add video for viewing attribute data>>
GIS Data Updates
The provided GIS data requires numerous updates, prior to our model simulation. We have built these updates into this tutorial to demonstrate some of the available TUFLOW SWMM model built processing tools.
The following updates are being made to Objects and Layers within TS01_001.gpkg
Update Conduit Details
Step 1 involves updating the From Node and To Node attribute information in Links-Conduits. This information is necessary to "build" the 1D SWMM network. It defines the Link/Node connections. The information we will be adding to Links-Conduits is extracted from Nodes--Junction and Nodes--Outfall automatically using the Conduits - Assign Node Fields tool from the Processing Toolbox.
- Select (Left mouse click) Links--Conduits in the QGIS Layers panel and Toggle Editing on.
- From the Processing Toolbox, select "Editing in place". This allows the editing of an existing Layer, instead of the creation of a new Layer.
- Select the Conduits - Assign Node Fields processing tool.
- Select Nodes--Junction and Nodes--Outfall in the SWMM Node Layers field.
- Select Modify All Features.
- Close the Conduits - Assign Node Fields processing tool.
- View the attributes associated with Links-Conduits to verify the data processing has been completed correctly. The From Node and To Node attribute information is now configured correctly.
Tip: If you wish to only update select objects during a future modelling project, instead of the entire Link--Conduits dataset, select the target objects first using the Feature by Area tool. The Conduits - Assign Node Fields tool will provide an option to Modify Selected Features, instead of Modify All Features.
<< Add video >>
Update Losses
Step 2, update the loss attributes in the Links-Conduits Layer. These values will be entered manually in this example using default values. Variation to the default values can be used in project models to reflect site specific information if desired.
- Select (Left mouse click) Links--Conduits in the QGIS Layers panel and Toggle Editing on.
- Right mouse click Links--Conduits in the QGIS Layers panel and select Open Attribute Table.
- Set:
- losses_Kentry = 0.5
- losses_kexit = 1.0
- Save Links--Conduits
<< Add video >>
An urban pipe network is added to the model in TUFLOW SWMM Module 2. In that situation, different loss attributes are required for the road culverts and underground stormwater pipe network links. To simplify the loss attibute update step in that situation, we will be introducing the Conduits - Assign Node Fields processing tool. It is however, not necessary for this Module 1 tutorial because all the 1D SWMM inputs are embankment culverts.
Update Junction Details
Step 3,requires updating the storage attributes in the Node--Junctions Layer. These values will be entered manually in this example, using generic values. Variation to the default values can be used in project models to reflect site specific information if desired.
- Select (Left mouse click) Nodes--Junctions in the QGIS Layers panel and Toggle Editing on.
- Right mouse click Nodes--Junctions in the QGIS Layers panel and select Open Attribute Table.
- Set the Apond attribute to 100 for all (3) objects.
- Save Nodes--Junction.
<< Add video >>
In TUFLOW SWMM Module 2, when we add underground pipe network infromation, we will require different Apond and Ysur attributes for the road culverts and underground pipe network junctions. To simplify the parameter update step in that situation, we will be introducing the Junctions - Set attributes processing tool. It is however, not necessary for this Module 1 tutorial because all the 1D SWMM inputs are embankment culverts.
Create 1D/2D Connections
The following instructions introduce a new tool that automates the creation of 1D/2D connections. For 1D SWMM, HX lines are required from the upstream end of the culvert, and SX connections are used at the downstream end of the culvert.
- Select (Left mouse click) Links-Conduits in the QGIS Layers panel.
- Use the select the Feature by Area tool to select all culvert objects in Links-Conduits.
- In the search box of the Processing Toolbox panel, type SWMM.
- From the SWMM list, choose the BC - Create channel endpoint 1D/2D connections.
- Select the following options:
- Input Conduits Layer = Links Conduits
- Offset distance = 2
- Length of BC lines = 10
- Output Layer= Select: Save to GeoPackage. Choose TS01_001.gpkg in the model\swmm folder and click Save. A Layer Name Window will open. Provide the following name: 2d_bc_SWMM_Connections_001_L.
<< Add video >>
SWMM Options
- Select the Options Layer in TS01_001.gpkg file.
- Select Toggle Editing to enable changes to be made to the Layer.
- Right click the Layer in the Layers Panel and select 'Open Attribute Table'.
- Update the following option:
- Start Date: 01/01/2020 (USA Date Format: MM/DD/YYY)
- Report step: 00:05:00
- Save and Toggle Editing off.
<< Add video >>
Export SWMM INP File
SWMM does not read TS01_001.gpkg directly as an input GIS file. SWMM requires a INP file
- Right click Links--Conduits in the QGIS Layers panel, and select TUFLOW >> SWMM - Export inp file.
- Select TS01_001.gpkg as the GeoPackage Input File.
- Set the SWMM output filename to TS01_001.inp in the TUFLOW/model/swmm folder.
- Select "Run", then "Close" after the processing is complete.
<< Add video >>
Simulation Control Files
TUFLOW Boundary Control File (TBC)
To differentiate the TUFLOW SWMM tutorials from the TUFLOW/ESTRY tutorials, TS will be used as the new file prefix in this series of tutorials.
- Rename M01_001.tbc as TS01_001.tbc in the TUFLOW_SWMM_Module_01\TUFLOW\model folder.
- Open TS01_001.tbc in a text editor and add the additional lines:
Read GIS BC == 2d_bc_SWMM_Connections_001_L ! Links the 1D culverts to the 2D domain
- Save the TBC.
<< Add video >>
TUFLOW SWMM Control File (TSCF)
A new control file, the TUFLOW SWMM Control File (TSCF), is introduced. SWMM is a 1D hydraulic solver. All 1D SWMM files and commands are referenced in the TUFLOW SWMM Control File.
- Create a new text file called TS01_001.tscf, saved in the TUFLOW_SWMM_Module_01\TUFLOW\model folder.
- Add the following command lines:
Read SWMM == swmm\TS01_001.inp ! 1D SWMM input file
- Save the TSCF.
<< Add video >>
TUFLOW Control File (TCF)
- Save a copy of the M02_5m_001.tcf as M03_5m_001.tcf in the Module_03\TUFLOW\runs folder.
- Open the M03_5m_001.tcf in a text editor:
Add the following line in the 'Model Inputs' section:
SWMM Control File == ..\model\TS01_001.tscf ! Reference the SWMM (1D) Control File
Add the following line in the 'Output Settings' section:
NetCDF Output Start Date == 2020-01-01 00:00 ! Sets the output units for the NetCDF time variable
- Make the following reference updates:
Spatial Database == ..\model\gis\TS01_001.gpkg ! Specify the location of the GeoPackage Spatial Database
BC Control File == ..\model\TS01_001.tbc ! Reference the TUFLOW Boundary Conditions Control File
- Save the TCF.
<< Add video >>
Running the Simulation
- Save a copy of _run_M02_HPC.bat as _run_TS01_HPC.bat in the TUFLOW_SWMM_Module_01\TUFLOW\runs folder.
- Update the batch file to reference the TS01_5m_001.tcf :
set exe="..\..\..\exe\2023-03-AD\TUFLOW_iSP_w64.exe"
set run=start "TUFLOW" /wait %exe% -b
%run% TS01_5m_001.tcf - Double click the batch file in Windows file explorer to run the simulation.
<< Add video >>
If your model simulation did not run. Here is a link to some comon Tutorial Trouble Shooting advice.
Check Files
Results
Plot time series results through the pipe network:
- Open TUFLOW Viewer in the QGIS TUFLOW Plugin.
- Select File > Load Results - Time Series. Navigate to the TS01_5m_001_swmm_ts.gpkg in the TUFLOW_SWMM_Module_01\TUFLOW\results folder and open it.
- Two additional files appear in the Layers panel:
- TS01_5m_001_PLOT_L
- TS01_5m_001_PLOT_P
- Select the TS01_5m_001_PLOT_L file in the Layers panel and using the 'Select Features' tool highlight one of the pipe lines (to highlight multiple hold down shift).
- Select one of the Time Series datasets shown with the
 icon and the 'Time Series' tab gets updated.
<< Add video >>
Plot longitudinal profiles from the Time Series datasets:
- The available long profile result types have a long profile icon
 and display in the 'Cross Section / Long Profile' tab.
<< Add video >>
Conclusion
- EPA SWMM Culverts were added to convey water through the three structures under the roads in the tutorial model.
- Check files were used to review the application of the boundary links.
- Results through the 1D network structures were assessed.
| Up |
|---|