QGIS Importing a Grid: Difference between revisions
No edit summary |
|||
| Line 10: | Line 10: | ||
<br> |
<br> |
||
* The .asc file can also be dragged and dropped into the QGIS session, rather than using the Add Raster Layer option. |
* The .asc file can also be dragged and dropped into the QGIS session, rather than using the Add Raster Layer option. |
||
=Coloring / Shading |
=Coloring / Shading= |
||
Note that by default the The default shading is grayscale so the import raster is likely to look gray. To change this to a simple colour shading right click on the layer in the layer control and select '''Properties'''. In the '''Style''' tab, drop the colour map to '''Pseudocolor'''. |
Note that by default the The default shading is grayscale so the import raster is likely to look gray. To change this to a simple colour shading right click on the layer in the layer control and select '''Properties'''. In the '''Style''' tab, drop the colour map to '''Pseudocolor'''. |
||
<br> |
<br> |
||
Revision as of 10:24, 11 January 2021
Introduction
The ESRI Arc/Info Grid (.asc) format is a widely used format for gridded datasets (such as DEMs and results files). The TUFLOW_to_GIS utility outputs in this file format.
Method
QGIS has native support for this format.
- ESRI grid (.asc) files can be directly opened in QGIS by selecting Layers >>> Add Raster Layer.
- Navigate to the desired file and select Open.
The opened grid will be displayed in the projection of the project. This should be set to the projection of the grids, to change the projection of the project see the Setting Project Projection page.
- The .asc file can also be dragged and dropped into the QGIS session, rather than using the Add Raster Layer option.
Coloring / Shading
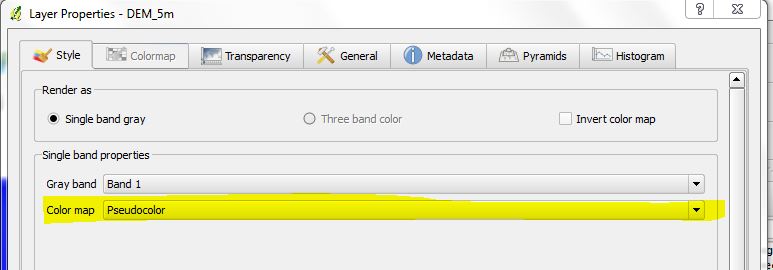
Note that by default the The default shading is grayscale so the import raster is likely to look gray. To change this to a simple colour shading right click on the layer in the layer control and select Properties. In the Style tab, drop the colour map to Pseudocolor.

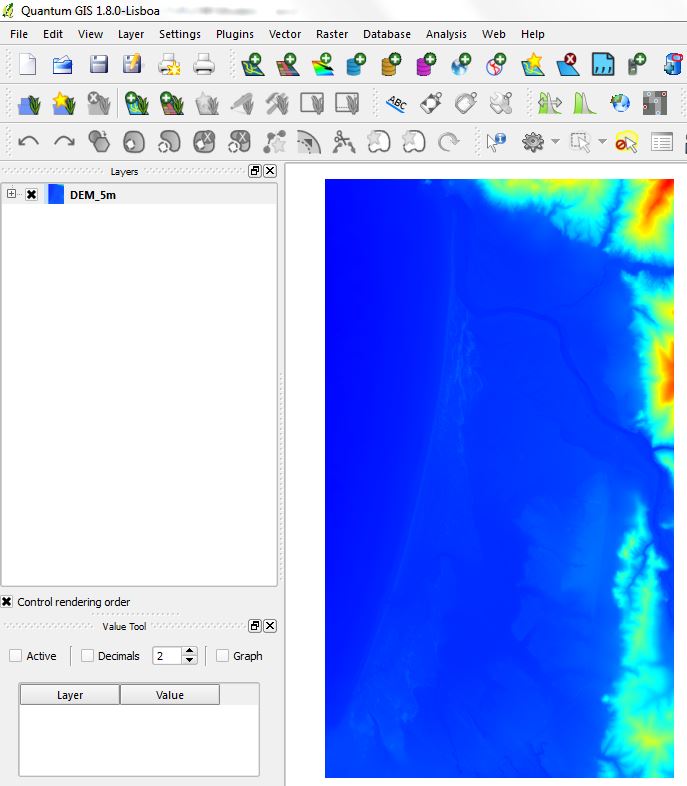
The raster grid should now have a color ramp applied. More advanced coloring can be applied by using the Colormap option (this enables a colormap tab).

If you are viewing a DEM, you may also wish to apply a relief shading to give the DEM a more "3D" appearance, to do this see the QGIS Relief Shading tip.