Ensight Point Time Series Plot: Difference between revisions
Jump to navigation
Jump to search
Content deleted Content added
Chris Huxley (talk | contribs) No edit summary |
Chris Huxley (talk | contribs) No edit summary |
||
| Line 11: | Line 11: | ||
* Select Mesh Slice = <b> Z </b> |
* Select Mesh Slice = <b> Z </b> |
||
* Select Value = <b> MID-RANGE </b> |
* Select Value = <b> MID-RANGE </b> |
||
[[File:Ensight_026.png| |
[[File:Ensight_026.png|200px]] |
||
* Deselect the clip line tool.<br> |
* Deselect the clip line tool.<br> |
||
[[File:Ensight_020.JPG]]<br> |
[[File:Ensight_020.JPG]]<br> |
||
*The clip should now remain within the view window and also show in the list of Parts <br> |
*The clip should now remain within the view window and also show in the list of Parts <br> |
||
[[File:Ensight_027.png| |
[[File:Ensight_027.png|200px]] |
||
<br> |
<br> |
||
| Line 23: | Line 23: | ||
* Select Sample = <b> At XYZ over time</b> |
* Select Sample = <b> At XYZ over time</b> |
||
* Select the desired variable. For example ''Depth'' or ''Water_Level'' <br> |
* Select the desired variable. For example ''Depth'' or ''Water_Level'' <br> |
||
[[File:Ensight_028.png| |
[[File:Ensight_028.png|200px]] |
||
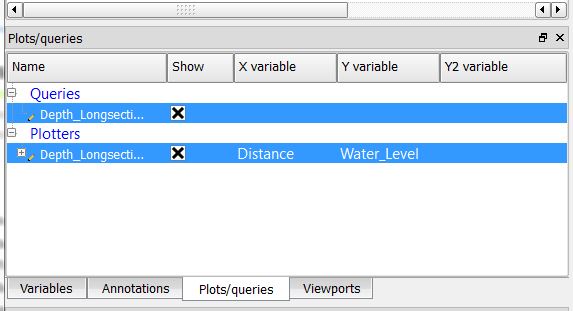
*This dataset will be added to the Plots/Queries window, and also to the display window as a graph. Double click the graph in the display window to update the graph display options (colors, labels, titles etc.). |
*This dataset will be added to the Plots/Queries window, and also to the display window as a graph. Double click the graph in the display window to update the graph display options (colors, labels, titles etc.). |
||
[[File:Ensight_024.JPG|450px]]<br> |
[[File:Ensight_024.JPG|450px]]<br> |
||
Revision as of 07:59, 18 February 2015
Create a clip line in the location where you would like to extract results.
- Select the clip line icon
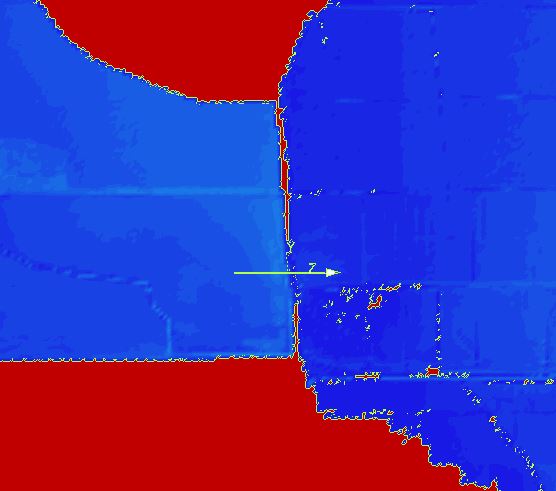
- Relocate the clip line. Selecting the centre is used to shift the location of the clip line. Selecting the start or end of the line can be used to alter the line extent.
- Select the parent Part 2D TUFLOW Elements
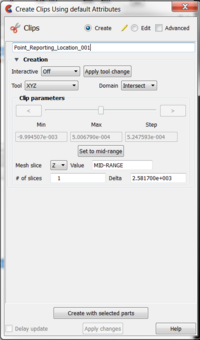
- Right Click >> Create >> Clips
- Name the Clip, for example Point_reporting_Location_001.
- Select Tool = XYZ
- Select Mesh Slice = Z
- Select Value = MID-RANGE
- Deselect the clip line tool.
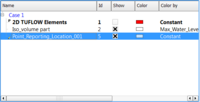
- The clip should now remain within the view window and also show in the list of Parts
Variables need to be associated with the clip:
- Select the clip part (left click the Part)
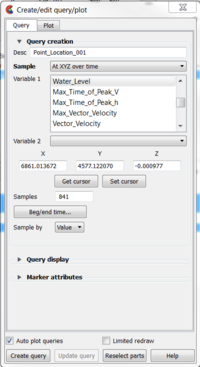
- Select query
- Select Sample = At XYZ over time
- Select the desired variable. For example Depth or Water_Level
- This dataset will be added to the Plots/Queries window, and also to the display window as a graph. Double click the graph in the display window to update the graph display options (colors, labels, titles etc.).
- Alternatively, unique graphs an be created for each dataset can be created. Right Click the query dataset>> Add to Plot
| Up |
|---|
