TUFLOW 2D Cell Size Selection: Difference between revisions
Jump to navigation
Jump to search
Content deleted Content added
Chris Huxley (talk | contribs) |
Chris Huxley (talk | contribs) |
||
| Line 12: | Line 12: | ||
== Rural Catchment Assessment Results == |
== Rural Catchment Assessment Results == |
||
| ⚫ | |||
{| class="wikitable " |
|||
[[File:Mesh_Converge_Grid_020.png|200px]][[File:Mesh_Converge_Exg_P4_020.png|400px]][[File:Mesh_Converge_Exg_P5_020.png|400px]]<br> |
|||
[[File:Mesh_Converge_Grid_050.png|200px]][[File:Mesh_Converge_Exg_P4_050.png|400px]][[File:Mesh_Converge_Exg_P5_050.png|400px]]<br> |
|||
| '''Cell Size''' || '''Location 4 Result'''|| '''Location 5 Result''' || '''Mesh Resolution Figure''' |
|||
[[File:Mesh_Converge_Grid_100.png|200px]][[File:Mesh_Converge_Exg_P4_100.png|400px]][[File:Mesh_Converge_Exg_P5_100.png|400px]]<br> |
|||
|- |
|||
[[File:Mesh_Converge_Grid_150.png|200px]][[File:Mesh_Converge_Exg_P4_150.png|400px]][[File:Mesh Converge Exg P5 150.png|400px]]<br> |
|||
[[File: |
| 10m || [[File:Mesh Converge Exg P4 010.png|400px]] || [[File:Mesh Converge Exg P5 010.png|400px]] ||[[File:Mesh_Converge_Grid_010.png|200px]] |
||
|- |
|||
[[File:Mesh_Converge_Grid_250.png|200px]][[File:Mesh_Converge_Exg_P4_250.png|400px]][[File:Mesh_Converge_Exg_P5_250.png|400px]]<br> |
|||
| 20m || [[File:Mesh Converge Exg P4 020.png|400px]] || [[File:Mesh Converge Exg P5 020.png|400px]] || [[File:Mesh_Converge_Grid_020.png|200px]] |
|||
|- |
|||
| ⚫ | |||
|- |
|||
| 100m || [[File:Mesh Converge Exg P4 100.png|400px]]|| [[File:Mesh Converge Exg P5 100.png|400px]] || [[File:Mesh_Converge_Grid_100.png|200px]] |
|||
|- |
|||
| 150m || [[File:Mesh Converge Exg P4 150.png|400px]] || [[File:Mesh Converge Exg P5 150.png|400px]] ||[[File:Mesh_Converge_Grid_150.png|200px]] |
|||
|- |
|||
| 200m || [[File:Mesh Converge Exg P4 200.png|400px]] || [[File:Mesh Converge Exg P5 200.png|400px]] ||[[File:Mesh_Converge_Grid_200.png|200px]] |
|||
|- |
|||
| 250m || [[File:Mesh Converge Exg P4 250.png|400px]] || [[File:Mesh Converge Exg P5 250.png|400px]] ||[[File:Mesh_Converge_Grid_250.png|200px]] |
|||
|} |
|||
= Urbanised Catchment Assessment Results == |
= Urbanised Catchment Assessment Results == |
||
Revision as of 13:06, 24 May 2018
This page is currently under construction.
Cell size convergence is an important concept in flood modelling.
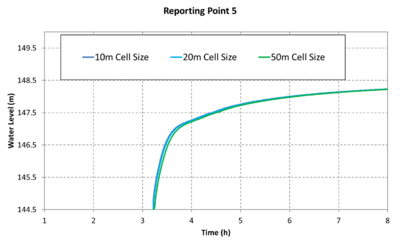
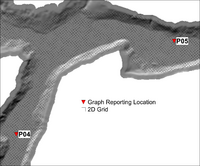
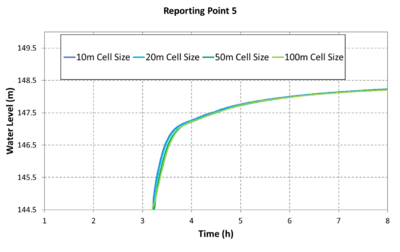
This test is designed to simulate flood wave propagation down a river valley following the failure of a dam. The valley DEM is ~0.8 km by ~17 km and the valley slopes downstream on a slope of ~0.01 in its upper region, easing to ~0.001 at lower elevations.
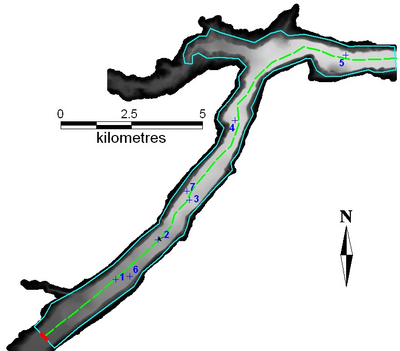

The inflow hydrograph shown below is applied as a boundary condition at the upstream end of the valley.

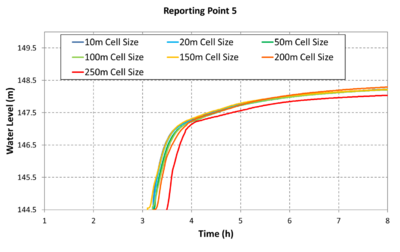
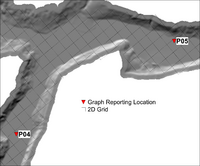
Rural Catchment Assessment Results
| Cell Size | Location 4 Result | Location 5 Result | Mesh Resolution Figure |
| 10m | 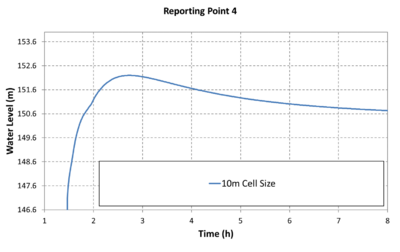 |
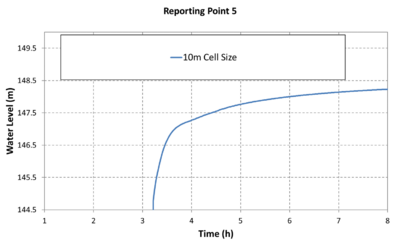 |
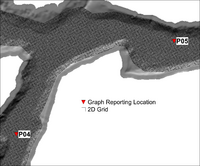
|
| 20m | 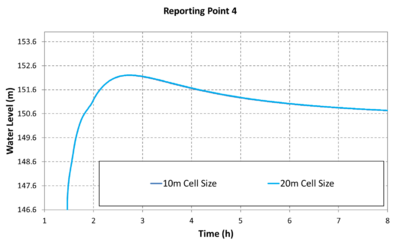 |
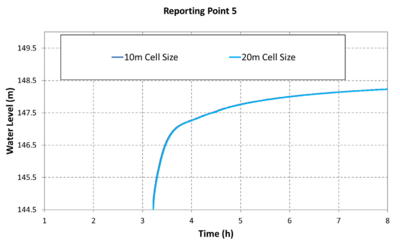 |
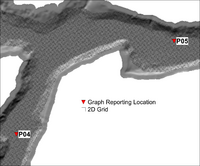
|
| 50m | 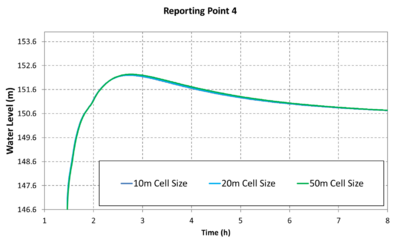 |
 |
|
| 100m | 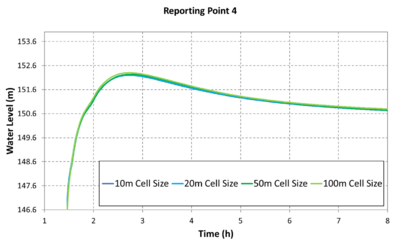 |
 |
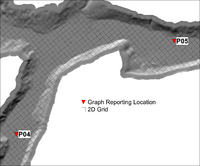
|
| 150m | 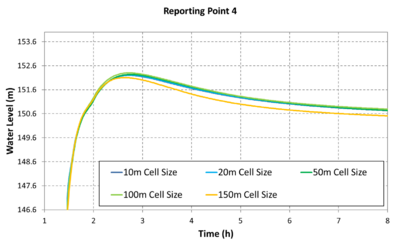 |
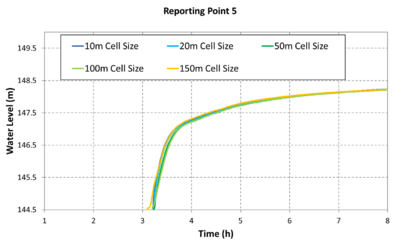 |
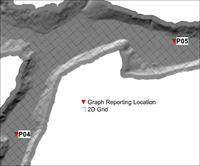
|
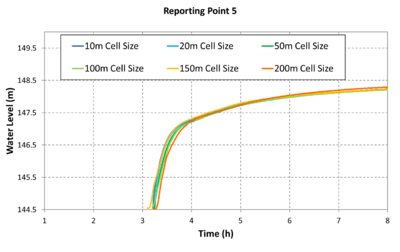
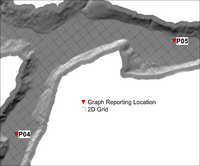
| 200m | 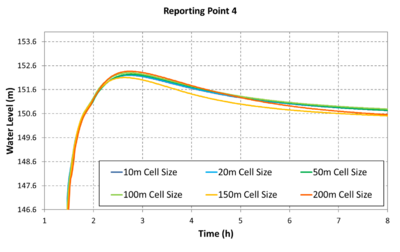 |
 |
|
| 250m | 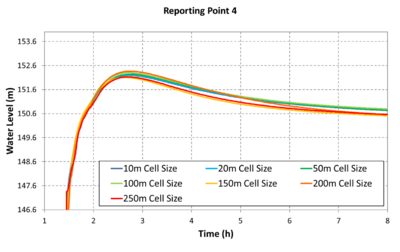 |
 |
|