Difference between revisions of "TUFLOW Viewer - Map Outputs - Vertical Profile"
Jump to navigation
Jump to search
Ellis Symons (talk | contribs) |
Ellis Symons (talk | contribs) |
||
| Line 15: | Line 15: | ||
===Examples=== | ===Examples=== | ||
[[File: Plotting_MapOutput_VerticalProfile.gif]] | [[File: Plotting_MapOutput_VerticalProfile.gif]] | ||
| + | |||
===Links=== | ===Links=== | ||
====Similar Tools==== | ====Similar Tools==== | ||
Revision as of 22:32, 6 April 2021

Tool Description
Plots a result profile down the water column at a given location. For 2D depth average results (e.g. TUFLOW Classic / HPC) this will be a single value down column. Users can choose one or multiple result types to plot at once.
To use the tool:
- Select which result type to plot using the down arrow next to the vertical profile plot icon in the toolbar
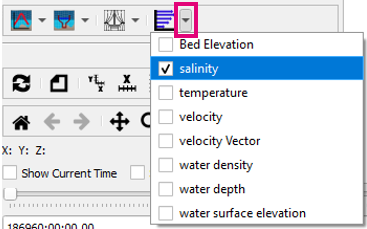
- Click off the drop down menu somewhere in a blank section of the TUFLOW Viewer toolbar
- Click the vertical profile icon so that it becomes indented and the cursor changes to a crosshair
- Left click a location on the results to extract a vertical profile.

Examples
