Difference between revisions of "TUFLOW Viewer - Time Series Outputs - Plotting Time Series"
Jump to navigation
Jump to search
Ellis Symons (talk | contribs) (Created page with "===Tool Description=== ===Examples=== ===Links=== ====Similar Tools==== * Load Results * TUFLOW_Viewer_-_Load_Results_-_Map_Outputs | Load...") |
Ellis Symons (talk | contribs) |
||
| Line 1: | Line 1: | ||
===Tool Description=== | ===Tool Description=== | ||
| + | The below steps outline how to plot a time series graph from time series outpupts: | ||
| + | <ol> | ||
| + | <li> Select a result type from the '''Time Series''' section - available time series result types will have a time series icon [[File:results_2.png | 15px]] to the left | ||
| + | [[File: Plotting_TimeSeries_TimeSeries.PNG]] | ||
| + | </ol> | ||
===Examples=== | ===Examples=== | ||
===Links=== | ===Links=== | ||
Revision as of 22:39, 7 April 2021
Tool Description
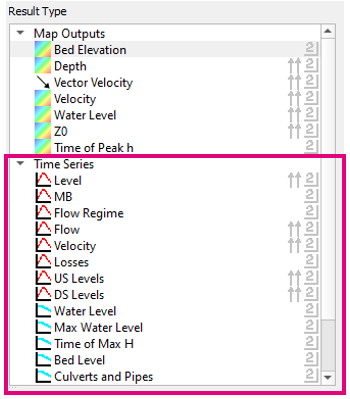
The below steps outline how to plot a time series graph from time series outpupts:
- Select a result type from the Time Series section - available time series result types will have a time series icon
 to the left