Difference between revisions of "TUFLOW Viewer - Time Series Outputs - Plotting Time Series"
Jump to navigation
Jump to search
Ellis Symons (talk | contribs) |
Ellis Symons (talk | contribs) |
||
| Line 9: | Line 9: | ||
</ol><Br> | </ol><Br> | ||
| − | + | Selecting features from the appropriate geometry type should be used depending on the result type. For example, to plot 1D flow, a feature from the _PLOT_L (line type) should be selected.<br> | |
To plot multiple result types, simply select multiple types in the '''Result Type''' panel.<Br> | To plot multiple result types, simply select multiple types in the '''Result Type''' panel.<Br> | ||
Revision as of 22:44, 7 April 2021
Tool Description
Time series results can be either 1D results or 2D PO / RL results and the process of plotting from them are identical.
The below steps outline how to plot a time series graph from time series outpupts:
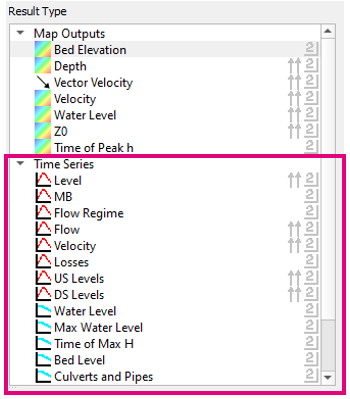
- Select a result type from the Time Series section - available time series result types will have a time series icon
 to the left
- Select a feature in one of the _PLOT_ GIS layers

Selecting features from the appropriate geometry type should be used depending on the result type. For example, to plot 1D flow, a feature from the _PLOT_L (line type) should be selected.
To plot multiple result types, simply select multiple types in the Result Type panel.