TUFLOW SWMM Tutorial M04: Difference between revisions
Chris Huxley (talk | contribs) |
Chris Huxley (talk | contribs) |
||
| Line 167: | Line 167: | ||
|} |
|} |
||
==Check Sucessful Completion of Multiple Simulations== |
|||
Open '''_TUFLOW Simulations.log''' from the '''TUFLOW_SWMM_Module_04\TUFLOW\runs''' folder. Confirm 'Finished' is tagged next to the entry for each of the six simulations we executed. This log confirms the model simulation was completed.<br> |
Open '''_TUFLOW Simulations.log''' from the '''TUFLOW_SWMM_Module_04\TUFLOW\runs''' folder. Confirm 'Finished' is tagged next to the entry for each of the six simulations we executed. This log confirms the model simulation was completed.<br> |
||
<br> |
<br> |
||
| Line 172: | Line 173: | ||
<br> |
<br> |
||
==Viewing Multiple Simulation Results== |
|||
===Load Results=== |
|||
Open the simulation results in QGIS. When loading multiple simulations which include 1D results (all with the same object IDs), a two step load workflow is recommended to avoid filling the QGIS layer panel with duplicate 1D object entries. |
Open the simulation results in QGIS. When loading multiple simulations which include 1D results (all with the same object IDs), a two step load workflow is recommended to avoid filling the QGIS layer panel with duplicate 1D object entries. |
||
<ol> |
<ol> |
||
| Line 184: | Line 187: | ||
* Select File > 'Load Results'. Navigate to the '''TUFLOW\runs''' folder and select '''TS04_5m_~e1~_~e2~_001.tcf'''. |
* Select File > 'Load Results'. Navigate to the '''TUFLOW\runs''' folder and select '''TS04_5m_~e1~_~e2~_001.tcf'''. |
||
* When asked which simulation to load, select all remaining results (except '''TS04_5m_01p_1hr_001'''). |
* When asked which simulation to load, select all remaining results (except '''TS04_5m_01p_1hr_001'''). |
||
* When asked 'Do you want to open result GIS layer?', select 'No'. |
* When asked 'Do you want to open result GIS layer?', select 'No'. The results will stil be loaded, though will all be associated with the GIS objects loaded for the '''TS04_5m_01p_1hr_001''' simulation. |
||
<li> In the QGIS Layers Panel, move the GIS layers to the top of the list. This will ensure these layers are displayed above all |
<li> In the QGIS Layers Panel, move the GIS vector (line and point) layers to the top of the list. This will ensure these layers are displayed above all mesh result layers in the project. |
||
<br><br> |
<br><br> |
||
{{Video|name=Animation_TS4_Results_02a.mp4|width=1350}} |
{{Video|name=Animation_TS4_Results_02a.mp4|width=1350}} |
||
| Line 191: | Line 194: | ||
</ol> |
</ol> |
||
===Mesh Results (Map Output)=== |
|||
Inspect the results for all events. |
Inspect the results for all events. |
||
<ol> |
<ol> |
||
<li>Zoom in to the |
<li>Zoom in to the pipe network area. |
||
<li>Click on the scalar dataset 'Depth' under the 'Result Type' in the TUFLOW Viewer 'Map Outputs' list. Toggle on the maximum depth output by clicking the [[File: max_output_icon.png]] symbol. |
<li>Click on the scalar dataset 'Depth' under the 'Result Type' in the TUFLOW Viewer 'Map Outputs' list. Toggle on the maximum depth output by clicking the [[File: max_output_icon.png]] symbol. |
||
<li>Click through the results in the 'Open Results' list to observe the different max depth values. |
<li>Click through the results in the 'Open Results' list to observe the different max depth values. |
||
| Line 199: | Line 203: | ||
{{Video|name=Animation_TS4_Results_03a.mp4|width=1350}} |
{{Video|name=Animation_TS4_Results_03a.mp4|width=1350}} |
||
<br> |
<br> |
||
===Vector Results (Pipe Network Output)=== |
|||
<li>In the QGIS Layers Panel, select (left click) on the '''TS04_5m_01p_1hr_001_swmm_ts_L''' layer. |
<li>In the QGIS Layers Panel, select (left click) on the '''TS04_5m_01p_1hr_001_swmm_ts_L''' layer. |
||
<li>Use the 'Select Features' tool to highlight 'Pipe |
<li>Use the 'Select Features' tool to highlight 'Pipe 3'. |
||
<li>In the 'Open Results' list, select all 1hr duration event results (hold Ctrl to select multiple). |
<li>In the 'Open Results' list, select all 1hr duration event results (hold Ctrl to select multiple). |
||
<li>Click on a scalar dataset 'Flow' under the 'Result Type' in the TUFLOW Viewer 'Time Series' list. |
<li>Click on a scalar dataset 'Flow' under the 'Result Type' in the TUFLOW Viewer 'Time Series' list. |
||
<li>Try multiple combinations of the simulation results to observe how the different events impacted flow through 'Pipe |
<li>Try multiple combinations of the simulation results to observe how the different events impacted flow through 'Pipe 3'. |
||
<li>Click the "Refresh" button to update the Plot Window after making new selections. |
|||
<li>Use the "Clear Plot" button to remove all data from teh Plot Window if needed prior to making a new selection. |
|||
<br><br> |
<br><br> |
||
{{Video|name=Animation_TS4_Results_04a.mp4|width=1350}} |
{{Video|name=Animation_TS4_Results_04a.mp4|width=1350}} |
||
Revision as of 09:52, 22 January 2024
Introduction
This tutorial, Module 4 of the TUFLOW SWMM tutorial dataset will demonstrate TUFLOW's in-bulit event management functionality. This powerful functionality runs multiple event combinations (e.g. magnitude, duration, temporal patterns, climate change) using a single set of control files, rather than creating a new set of control files for every event simulation. This tutorial demonstrates how event management can be used on a smaller scale, running only 6 models.
The real power of event management is seen when running a model of a much greater size. For example, without implementing event management, a project requiring simulation of the following event combinations would require 144 TCF and bc_dbase files:
- 6 x Event Magnitude: 01%, 2%, 5%, 10%, 20% and 50% Annual Exceedance Probability (AEP)
- 8 x Event Duration: 1, 2, 3, 6, 9, 12, 18 and 24 hour storm
- 3 x Climate Change Planning Horizon: current climate, 2050, 2100
Using predefined naming conventions, with TUFLOW's event management functionality, all the events can be executed from a single TCF and bc_dbase file!
This feature of TUFLOW makes management of the model files easier, ensures consistency between the simulations and improves project quality control by reducing the likelihood of human error associated with incorrect file referencing.
TUFLOW SWMM Tutorial Module 4 builds from the model created in TUFLOW SWMM Tutorial Module 3. The completed TUFLOW SWMM Module 3 model is provided in the TUFLOW_SWMM_Module_04\TUFLOW folder of the download dataset as the starting point for this tutorial. If you are not already familiar with TUFLOW SWMM linking, we recommend completing TUFLOW SWMM Modules 1, 2 and 3 prior to starting this tutorial.
Simulation Control Files
TUFLOW's automated event management operates by introducing wildcard referencing into the boundary condition database.
A new control file, called the 'TUFLOW Event File' (TEF) is added. It lists all event titles that are applied to the wildcard character in the boundary condition database. It also lists unique commands to associate with the specific events.
Models are executed using a batch file, with the event specifically listed as a variable in the batch file syntax.
This tutorial example will upgrade our single simulation model to run six event simulations. The simulations will cater for three Annual Exceedance Probability (AEP) event magnitudes: 5%, 2% and 1% AEP. In Average Recurrence Interval (ARI) terminology, this translates to the 1 in 20, 50 and 100 year ARI events. These three design events will be simulated for two event storm durations: 1 and 2 hours.
TUFLOW Boundary Condition Database (bc_dbase)
The first task when upgrading a model to include Event Management functionality is to decide on a naming convention for the event wildcard characters to be used in the bc_dbase.csv.
- Event Magnitude: AEP
- Event Duration: DUR
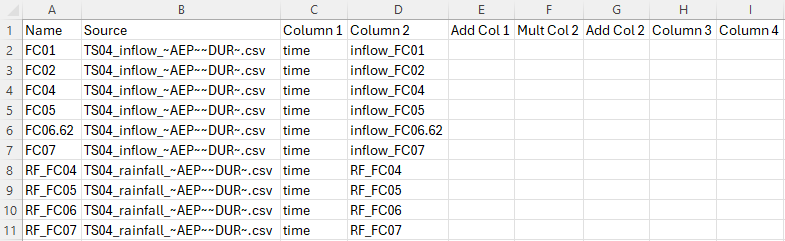
Update the bc_dbase with event magnitude and event duration wildcard characters.
- Navigate to the TUFLOW_SWMM_Module_04\Tutorial_Data folder. Copy and paste the following files to the TUFLOW_SWMM_Module_04\TUFLOW\bc_dbase folder. These files contain the inflows and rainfall for each event magnitude and duration.
- TS04_inflow_05p1hr.csv
- TS04_inflow_05p2hr.csv
- TS04_inflow_02p1hr.csv
- TS04_inflow_02p2hr.csv
- TS04_inflow_01p1hr.csv
- TS04_inflow_01p2hr.csv
- TS04_rainfall_05p1hr.csv
- TS04_rainfall_05p2hr.csv
- TS04_rainfall_02p1hr.csv
- TS04_rainfall_02p2hr.csv
- TS04_rainfall_01p1hr.csv
- TS04_rainfall_01p2hr.csv
The files with 'rainfall' in their name are rainfall depth hyetographs used to define rainfall timeseries in the SWMM urban hydrology section of the model. - Save a copy of the bc_dbase_TS03_001.csv as bc_dbase_TS04_001.csv.
- Open the file and make the following updates to the 'Source' column. The AEP and DUR wildcards must be between the special character ~ to function as a variable. Note, columns E to I are to remain blank. The final bc_dbase_TS04_001.csv should look like this:
- Save bc_dbase_TS04_001.csv.

TUFLOW Event File (TEF)
- Navigate to the TUFLOW_SWMM_Module_04\Tutorial_Data folder. Copy the TS04_Event_File.tef to the TUFLOW_SWMM_Module_04\TUFLOW\runs folder.
- Open the TEF in a Text Editor (Notepad++ is recommended). There are three event magnitudes and two event durations listed:
- Event Magnitudes: 5% , 2% and 1% AEP
- Event Durations: 1hr and 2hrs
- The event specific commands are contained between the Define Event and End Define commands.
- The BC Event Source command is linked to the bc_dbase file (bc_dbase_TS04_001.csv). In the below examples, any occurrence of '~AEP~' in bc_dbase_TS04_001.csv will be replaced with '05p' and any occurrence of '~DUR~' in bc_dbase_TS04_001.csv will be replaced with '1hr'. Also, when the 1 hour event is called the simulation, the end time will be set to 2 hours (instead of 3 hours, as per the other simulations).
! EVENT MAGNITUDES
Define Event == 05p- BC Event Source == ~AEP~ | 05p
! EVENT DURATIONS
Define Event == 1hr- BC Event Source == ~DUR~ | 1hr
End Time == 2 - When TUFLOW runs a simulation, it reads all of the defined events in the TEF, though only uses the event variables specified in the batch file. We will create a compatible batch file shortly.
TUFLOW Control File (TCF)
- Open TS03_5m_001.tcf in a Text Editor (Notepad++ is recommended). Save the file as TS04_5m_~e1~_~e2~_001.tcf in the TUFLOW_SWMM_Module_04\TUFLOW\runs folder.
- Make the following reference update:
BC Database == ..\bc_dbase\bc_dbase_TS04_001.csv ! Reference the Boundary Conditions Database
- Add the following commands to reference the TEF at the end of the TCF:
! EVENTS
Event File == TS04_Event_File.tef ! Reference the TUFLOW Event File
The location of this command in the TCF is important. If there are any commands associated with an event which overwrite other existing commands (such as End Time ==), the TEF file needs to be processed last for it to take precedence over other commands fulfilling the same purpose. Referencing this file in the last line in the TCF ensures this order of operation occurs as intended.
- Save the TCF.
Running the Simulation
- Save a copy of _run_TS03_HPC.bat as _run_TS04_HPC.bat in the TUFLOW_SWMM_Module_04\TUFLOW\runs folder.
- Update the batch file to reference the TS04_5m_~e1~_~e2~_001.tcf and include event switches (-e1, -e2) defining event magnitude and event duration:
set exe="..\..\..\exe\2023-03-AD\TUFLOW_iSP_w64.exe"
set run=start "TUFLOW" /wait %exe% -b
%run% -e1 05p -e2 1hr TS04_5m_~e1~_~e2~_001.tcf
%run% -e1 05p -e2 2hr TS04_5m_~e1~_~e2~_001.tcf
%run% -e1 02p -e2 1hr TS04_5m_~e1~_~e2~_001.tcf
%run% -e1 02p -e2 2hr TS04_5m_~e1~_~e2~_001.tcf
%run% -e1 01p -e2 1hr TS04_5m_~e1~_~e2~_001.tcf
%run% -e1 01p -e2 2hr TS04_5m_~e1~_~e2~_001.tcf
- Save the batch file and double click it in Windows File Explorer to run the simulation.
If the model simulation doesn't run, here is a link to some common Trouble Shooting advice.
Troubleshooting
Did your TUFLOW SWMM model fail to run successfully? If so, here is a link to a troubleshooting guide: TUFLOW SWMM Troubleshooting.
Advanced Looping Batch File (Optional)
Looping batch files are a powerful tool to enable high volume simulation management with the least amount syntax, and subsequently manual effort. For example, the following looped batch file executed 1440 simulation using 15 lines of syntax!

We will convert our sequential formatted batch file to a looped format:
- Save a copy of _run_TS04_HPC.bat as _run_TS04_HPC_loop.bat in the TUFLOW_SWMM_Module_04\TUFLOW\runs folder.
- Add the following commands. Indentation is important in batch files, insert tabs to match the below spacing:
echo off
set exe="..\..\..\exe\2023-03-AD\TUFLOW_iSP_w64.exe"
set run=start "TUFLOW" /wait %exe% -b
set AEP=05p 02p 01p
set DUR=1hr 2hr
for %%a in (%AEP%) do (
- for %%b in (%DUR%) do (
- echo Running %%a %%b
%run% -e1 %%a -e2 %%b TS04_5m_~e1~_~e2~_001.tcf
Note: The 'AEP' and 'DUR' are user defined batch file variables. Projects may use different variable names. The 'AEP' refers to an event magnitude (Annual Exceedance Probability) and 'DUR' refers to an event duration.
- Save the batch file and double click it in Windows File Explorer to run the simulation.
If the model simulation doesn't run, here is a link to some common Trouble Shooting advice.
Check and Result Files
When the TUFLOW models were executed via the batch file, the names of check and result files should have been updated to include the event variables from the simulation. For example:
| TCF | Event 1 (-e1) | Event 2 (-e2) | Check and Result filename |
|---|---|---|---|
| TS04_5m_~e1~_~e2~_001.tcf | 05p | 1hr | TS04_5m_05p_1hr_001 |
| 05p | 2hr | TS04_5m_05p_2hr_001 | |
| 02p | 1hr | TS04_5m_02p_1hr_001 | |
| 02p | 2hr | TS04_5m_02p_2hr_001 | |
| 01p | 1hr | TS04_5m_01p_1hr_001 | |
| 01p | 2hr | TS04_5m_01p_2hr_001 |
Check Sucessful Completion of Multiple Simulations
Open _TUFLOW Simulations.log from the TUFLOW_SWMM_Module_04\TUFLOW\runs folder. Confirm 'Finished' is tagged next to the entry for each of the six simulations we executed. This log confirms the model simulation was completed.
Viewing Multiple Simulation Results
Load Results
Open the simulation results in QGIS. When loading multiple simulations which include 1D results (all with the same object IDs), a two step load workflow is recommended to avoid filling the QGIS layer panel with duplicate 1D object entries.
- Open TUFLOW Viewer from the TUFLOW Plugin toolbar.
- Open 1D and 2D results: Select File > 'Load Results'. Navigate to the TUFLOW\runs folder and select TS04_5m_~e1~_~e2~_001.tcf.
- When asked which simulation to load, select TS04_5m_01p_1hr_001.
- When asked 'Do you want to open result GIS layer?', select 'Yes'.
- After TS04_5m_01p_1hr_001 has loaded, open the remaining result files:
- Select File > 'Load Results'. Navigate to the TUFLOW\runs folder and select TS04_5m_~e1~_~e2~_001.tcf.
- When asked which simulation to load, select all remaining results (except TS04_5m_01p_1hr_001).
- When asked 'Do you want to open result GIS layer?', select 'No'. The results will stil be loaded, though will all be associated with the GIS objects loaded for the TS04_5m_01p_1hr_001 simulation.
- In the QGIS Layers Panel, move the GIS vector (line and point) layers to the top of the list. This will ensure these layers are displayed above all mesh result layers in the project.

Mesh Results (Map Output)
Inspect the results for all events.
- Zoom in to the pipe network area.
- Click on the scalar dataset 'Depth' under the 'Result Type' in the TUFLOW Viewer 'Map Outputs' list. Toggle on the maximum depth output by clicking the
 symbol.
- Click through the results in the 'Open Results' list to observe the different max depth values.
Vector Results (Pipe Network Output)
- In the QGIS Layers Panel, select (left click) on the TS04_5m_01p_1hr_001_swmm_ts_L layer.
- Use the 'Select Features' tool to highlight 'Pipe 3'.
- In the 'Open Results' list, select all 1hr duration event results (hold Ctrl to select multiple).
- Click on a scalar dataset 'Flow' under the 'Result Type' in the TUFLOW Viewer 'Time Series' list.
- Try multiple combinations of the simulation results to observe how the different events impacted flow through 'Pipe 3'.
- Click the "Refresh" button to update the Plot Window after making new selections.
- Use the "Clear Plot" button to remove all data from teh Plot Window if needed prior to making a new selection.
Conclusion
- Automated Event Management functionality was added to the TUFLOW SWMM model.
- Multiple event simulations were run in sequence from a batch file.
- Creation of looped batch file was demonstrated for the efficient execution of bulk simulations.
- Multiple event simulation results were inspected using the QGIS TUFLOW Viewer.
Other TUFLOW SWMM Tutorials
- TUFLOW SWMM Module 1 - 1D SWMM Culverts
- TUFLOW SWMM Module 2 - 1D SWMM Pipe Network / 2D TUFLOW Direct Rainfall Hydrology
- TUFLOW SWMM Module 3 - 1D SWMM Pipe Network / 1D SWMM Urban Hydrology
- TUFLOW SWMM Module 4 - 1D SWMM Pipe Network / 1D SWMM Urban Hydrology: Executing multiple different event simulations from a single model control file.
| Up |
|---|