Tutorial M01 Results QGIS update V2 draft
Introduction
QGIS is used to view the grid and mesh 2D results (as well as the TUFLOW 1D results). This section describes how to view the following results using the TUFLOW Viewer 2:
- The grid results (.tif) are inspected with the Profile Tool plugin. For installation, see Installation of Profile Tool
- The mesh results (.xmdf), including the bed elevation, are inspected with the TUFLOW Viewer 2 as part of the TUFLOW Plugin. More information on TUFLOW Viewer 2 documentation including installation, please see TUFLOW Viewer 2 installation. For installation of the TUFLOW plugin, please see Installation of TUFLOW Plugin.
- The time series results (tpc) using the 2d_po using the TUFLOW Viewer 2.
Method
View grid results with Profile Tool:
- Load the M01_5m_001_h_Max.tif file from the Module_01\TUFLOW\results\grids folder. It can either be dragged and dropped into QGIS, or loaded by selecting Layer > Add Layer > Add Raster Layer from the menu.
- This displays the maximum water level in the model recorded during the whole simulation.
- Use the Profile Tool to view the maximum water level and DEM.
View mesh results (Map Outputs) with TUFLOW Viewer 2:
- Select TUFLOW Viewer 2; more information on how to install TUFLOW Viewer 2, please see TUFLOW Viewer 2 installation.
-
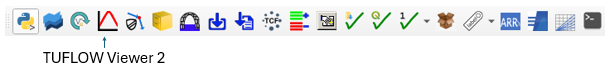
Click on the TUFLOW Viewer 2 from the TUFLOW plugin toolbar:
- Open the Map Outputs and Time Series results independently using:
- Drag and drop the M01_5m_001.xmdf from the Module_01\TUFLOW\results\ folder > to select the time series output results
- Drag and drop the M01_5m_001.tpc from the Module_01\TUFLOW\results\plot folder > to select the time series output results
- The Map Outputs show scalar datasets, e.g. depth and velocity, and vector datasets, e.g. velocity vectors. Only one scalar and one vector dataset can be displayed at the same time.
- Select M01_5m_001 from the Layers Pane, then in the 'Datasets' tab, click on the scalar dataset 'Depth' under the Result Type. Using the 'Temporal Controller' scroll through the output times. The results update as new output times are selected. Note: The styling of the Map Outputs can be changed by right clicking on each result dataset and editing the 'Contours'.
- Click on a vector dataset 'Vector Velocity' to add it to the displayed 'Depth' and visualise them together. The vector output shows both direction and magnitude.
Note: The appearance of vectors (colour, line width, symbology) can be changed by selecting the 'Vectors' tab.

View mesh results (Time Series) with TUFLOW Viewer 2 from the 2d_po files:
- View the line time series for flow (Type Q_). Choose the M01_5m_001_PLOT_L in the layer panel. Select TUFLOW Viewer 2, ensure the results M01_5m_001 is selected, then choose a Flow as the data type, and using the 'Selection' tool, click on the PO line. This shows the flow data across the 2d_po line.
- View the point time series for Level and Velocity dataset (Type H_ and V_). Choose M01_5m_001_PLOT_P in the Layers panel, ensure the results M01_5m_001 is selected, then choose a Level and Velocity as the data type, and using the 'Selection' tool, click on the PO point. This shows level and velocity at the point. A secondary axis can also be chosen, by right clicking on the graph and use option 'move to secondary axis'.
Conclusion
- The basics of viewing 2D TUFLOW results in QGIS using the TUFLOW Viewer 2 were covered.
- For further functionality, see TUFLOW Viewer 2 documentation.
| Up |
|---|