QGIS TUFLOW Arch Bridge Editor
This Page is Currently Under Construction
The Interface
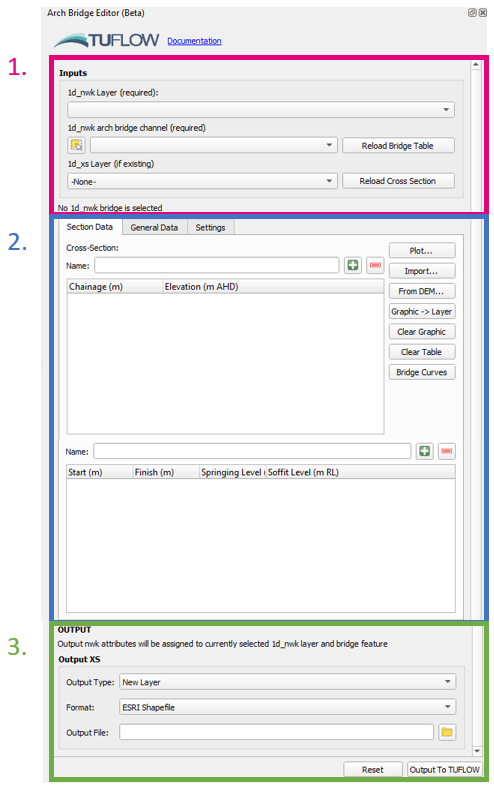
- GIS Inputs
- Location for providing 1d_nwk and 1d_xs inputs. The 1d_nwk layer and the bridge feature must already exist. It is not required that the arch bridge attributes are filled out, however the spatial geometry should be represented already (i.e. the polyline must already be drawn).
- The 1d_nwk layer should be selected in the first dropdown box, and the arch bridge feature in the second dropdown box. The arch bridge can be selected within the map window using the selection tool
(from within the arch bridge editor dock, not the standard QGIS tool). The tool will automatically find any 1d_xs features intersecting the bridge polyline if a 1d_xs layer is selected in the third dropdown box. If "-None" is selected in the third dropdown box, the tool will automatically create a 1d_xs layer.
- The text below the GIS inputs will provide the status on the GIS inputs e.g. Whether the tool has found any 1d_xs intersecting the arch bridge polylline.
- Arch Bridge Tables
- Location for viewing and editing the waterway cross-section and bridge tables. The tables will load automatically (if starting empty) if data is found in the GIS inputs. The tables can also be reloaded from the GIS inputs using the reload buttons next to the relevant GIS inputs.
- A name must be provided for both the cross-section and bridge tables.
- Numerous options are provided for creating/importing/editing/visualising the tables on the right-hand side of the cross-section table (these can be used for both tables). See Arch Bridge Table Options for more information.
- The "General Data" tab contains other possible parameters for arch bridge modelling in TUFLOW (see relevant section of the TUFLOW Manual / 2022 Release Notes).
- TUFLOW Outputs
- Location for specifying output options. See Output Options for more information on the output types.
- "Reset" will reset inputs in the GUI so the user can start from a clean interface.
- "Output to TUFLOW" will run the tool.
Arch Bridge Table Options
Creating Tables
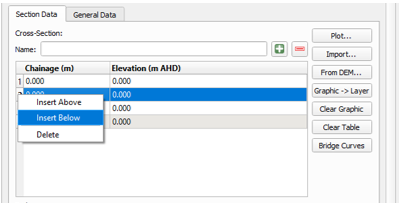
The +/- symbols can be used to add and remove rows from the arch bridge tables. Adding and removing rows can also be done via the context menu by right-clicking the row numbers on the left-hand side of the table. The tables also support copying and pasting values from spreadsheets.
Import From Text File
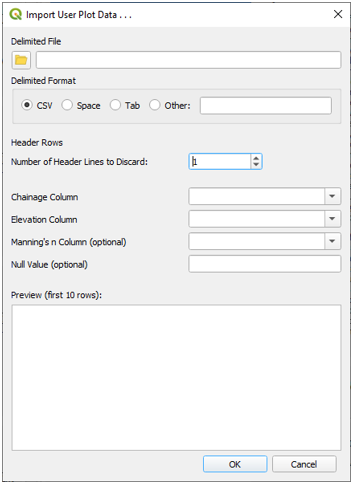
Values can also be imported from text files using "Import > Import Data From Text File" and using the wizard to specify the delimiter and which columns to import.
Import From Flood Modeller
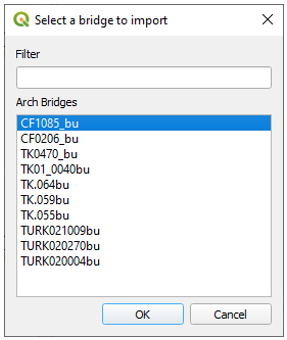
Arch bridge data can be imported from a flood modeller ".dat" file using "Import > Import Data From FM .dat File". The tool will scan the input file for all arch bridges and give the user a list of possible imports. Only one bridge can be imported at a time (for a single run of the tool).
From DEM
The cross-section can be generated by cutting a section from an open raster layer. This can be done by using "From DEM > [select desired DEM]" then drawing a line in the map window (left-click to add a vertex, and right-click to finish). The drawn line will not be used when generating the spatial location of any 1d_xs feature and can therefore be drawn anyway and does not need to intersect the arch bridge polyline (e.g. it could be drawn upstream of the bridge as a representative cross-section).
The graphic layer can be cleared from the map window using "Clear Graphic". The graphic layer can also be exported to a SHP file by using "Graphic -> Layer".
Visualising Tables
Plot
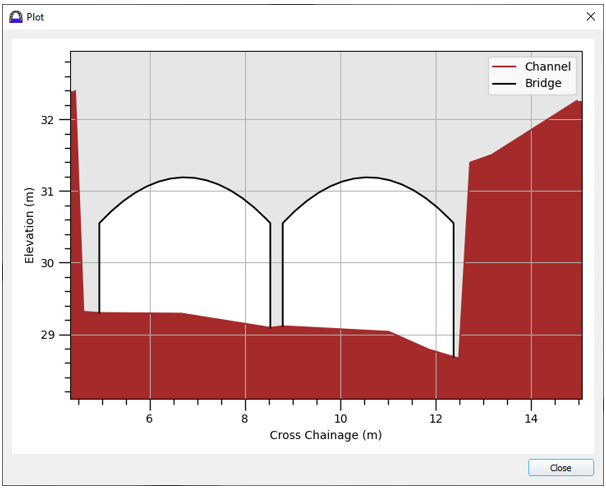
The cross-section and the bridge can be visualised using the "Plot" button. The cross-section can be plotted without any bridge data, however the bridge cannot be plotted without any cross-section data.
Bridge Curves
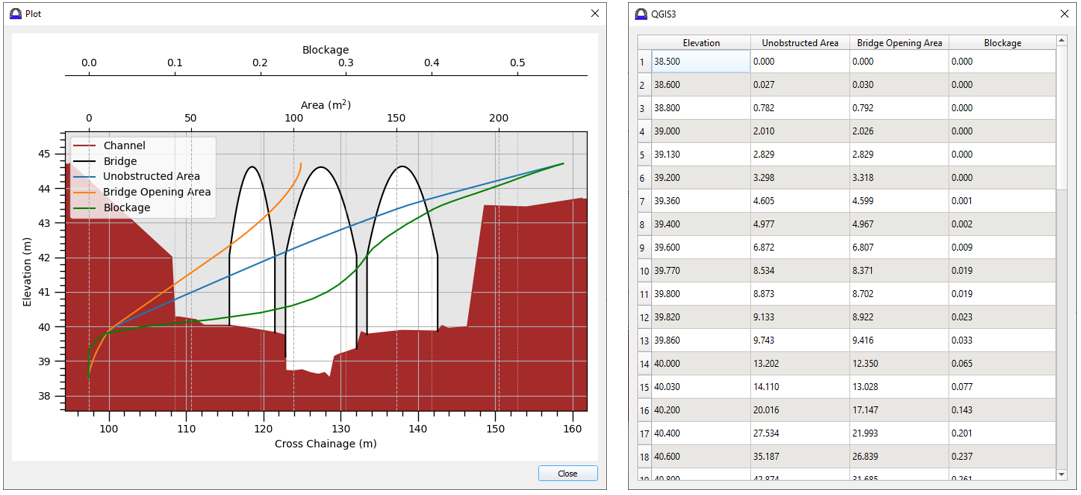
Post-processed arch bridge curves can be imported to view along side the plotted bridge data, or by themselves, by using "Bridge Curves > Import Bridge Curve From EOF". As the menu name suggests, the processed bridge inputs can be imported into the editor from the Estry Output File (EOF). This requires the pre-processing of the arch bridge data to have been completed by TUFLOW (this is done sometime in the initialisation phase of a TUFLOW run and therefore does not require TUFLOW to have finished before checking).
Output Options
In all output options, the 1d_nwk attributes of the input layer and selected feature will be overwritten with the data from the bridge editor. The below options refer to the 1d_xs output. Any newly generated 1d_xs feature will be drawn as single line perpendicular to the arch bridge polyline at the mid point.
New Layer
This option will create a new TUFLOW 1d_xs layer and populate it with the bridge cross-section.
Append to Existing Layer
This option will create a new 1d_xs feature in the selected 1d_xs layer (third dropdown option in the GIS inputs). This option requires an existing layer to be selected (cannot use "-None-" in the XS layer dropdown).
Overwrite Existing Items
This option will overwrite any existing 1d_xs feature if one is already intersecting the arch bridge polyline. If there is no existing intersecting feature, then a new feature will be appended to the 1d_xs layer (same as "Append to Existing Layer" output option above). This option requires an existing layer to be selected (cannot use "-None-" in the XS layer dropdown).
Refactoring Fields
The new arch bridge type in TUFLOW requires a "Type" field character length longer than the GIS empty types prior to 2022 release provided (i.e. 'BArch' requires 5 characters, the character length of the "Type" field in the 1d_nwk empty type prior to the 2022 release was limited to 4). If the 1d_nwk layer is detected to have insufficient length in the "Type" field, the tool will refactor the fields so they match the 2022 release 1d_nwk empty type. This will be ouput as a temporary "memory" layer in QGIS. This layer will be lost if QGIS is closed so it is imperative that the user saves this data to disk otherwise it will be lost.
Example: Creating a New Arch Bridge
This example demonstrates how to create a new arch bridge input from scratch using bridge data from an existing Flood Modeller model. The data for this model is not publically available, and serves only as a demonstration rather than a "follow along" tutorial. The steps undertaken are listed below
- Create a new 1d_nwk layer
- Draw the arch bridge channel
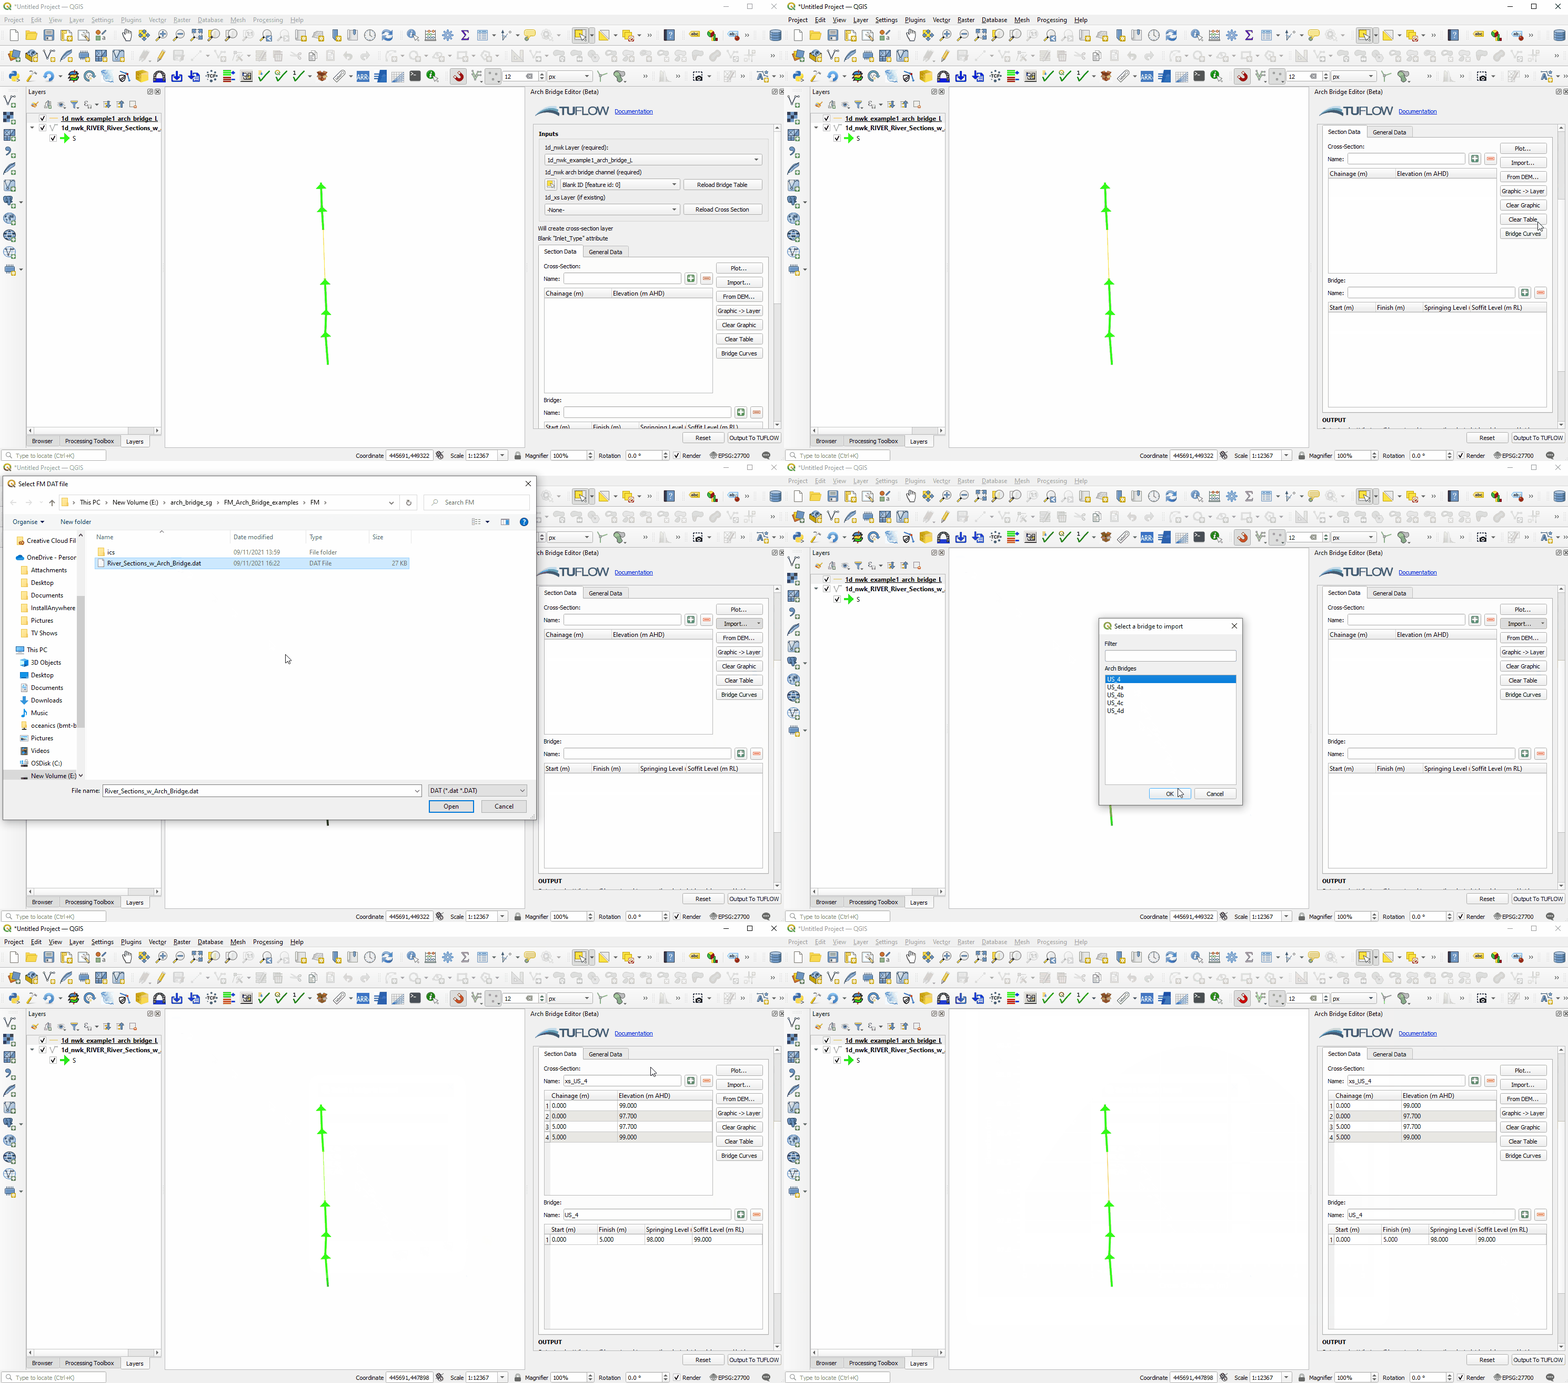
- Populate the GIS inputs in the arch bridge editor
- Import bridge information from an existing Flood Modeller .dat file
- Run the tool to create a new 1d_xs layer
1. Create a new 1d_nwk layer
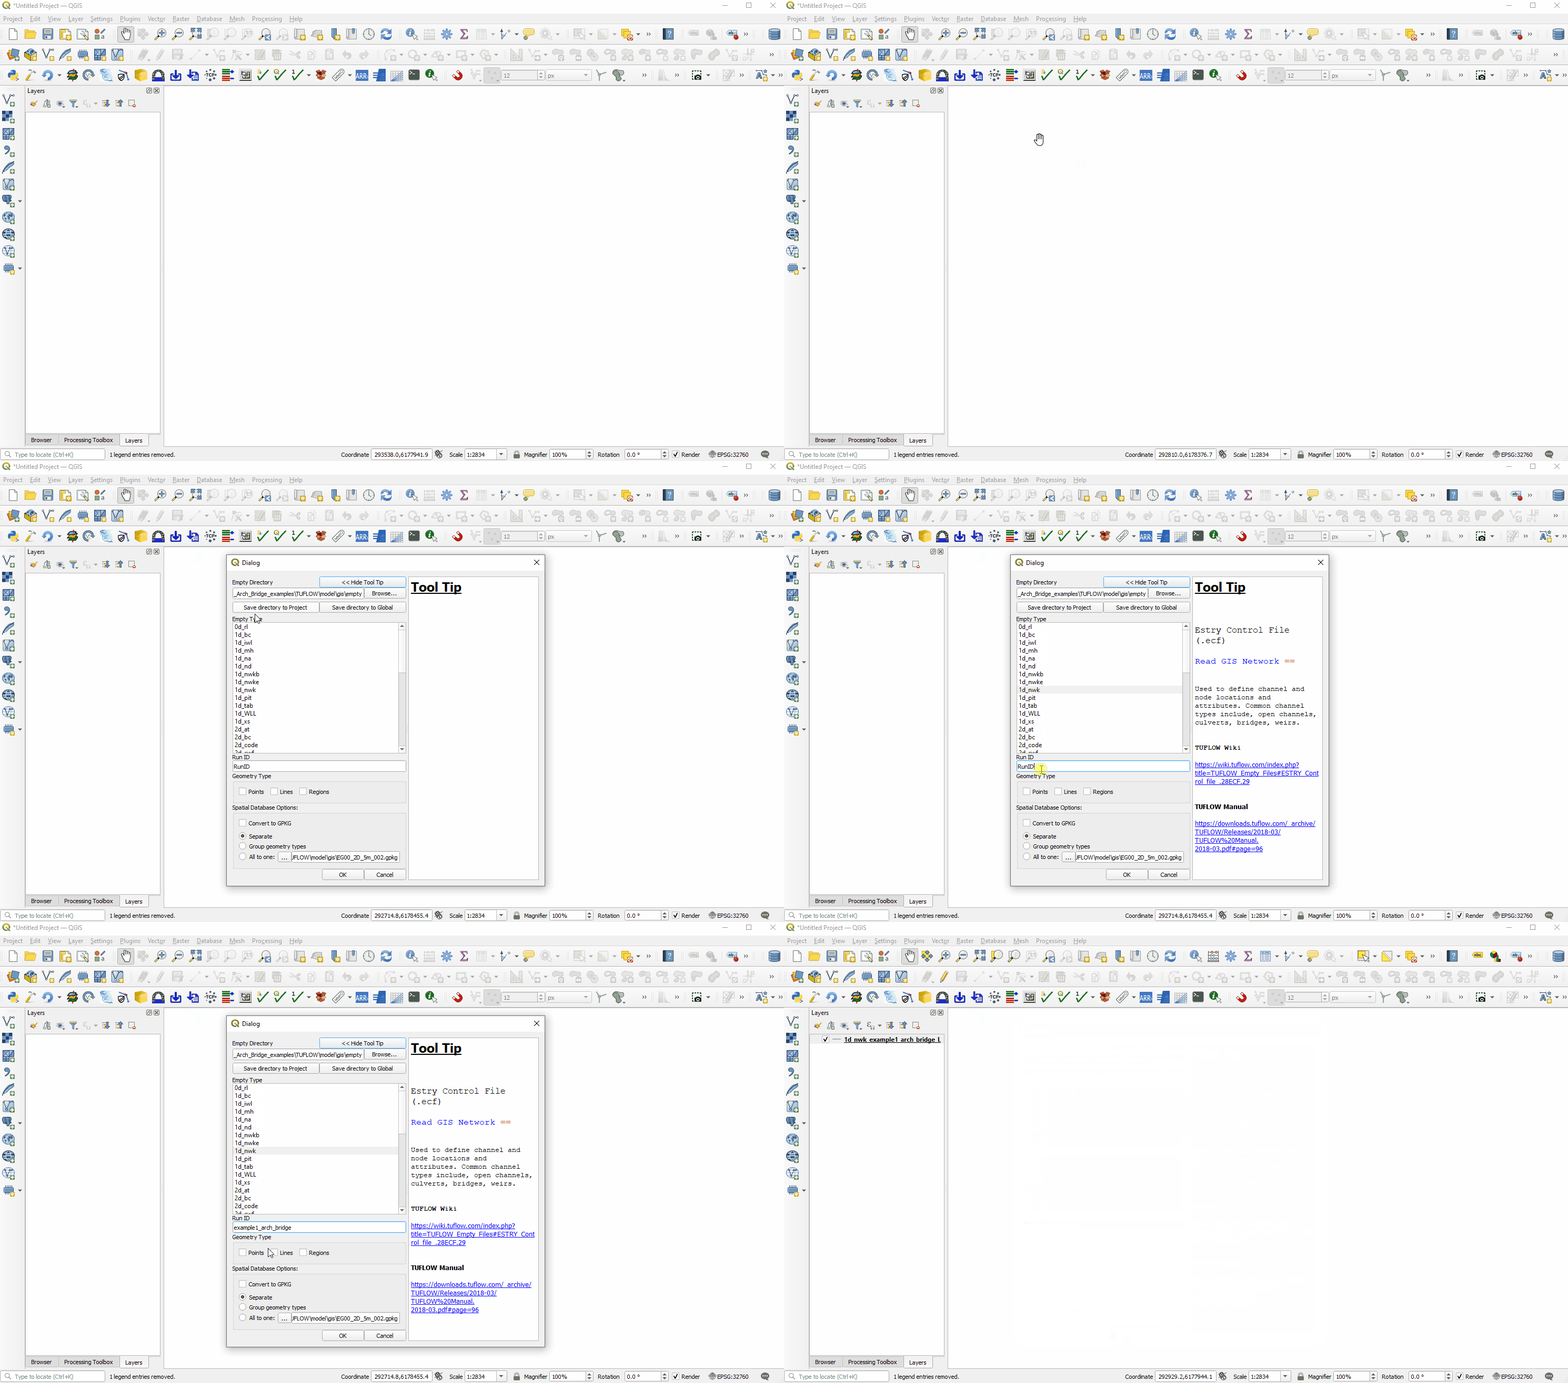
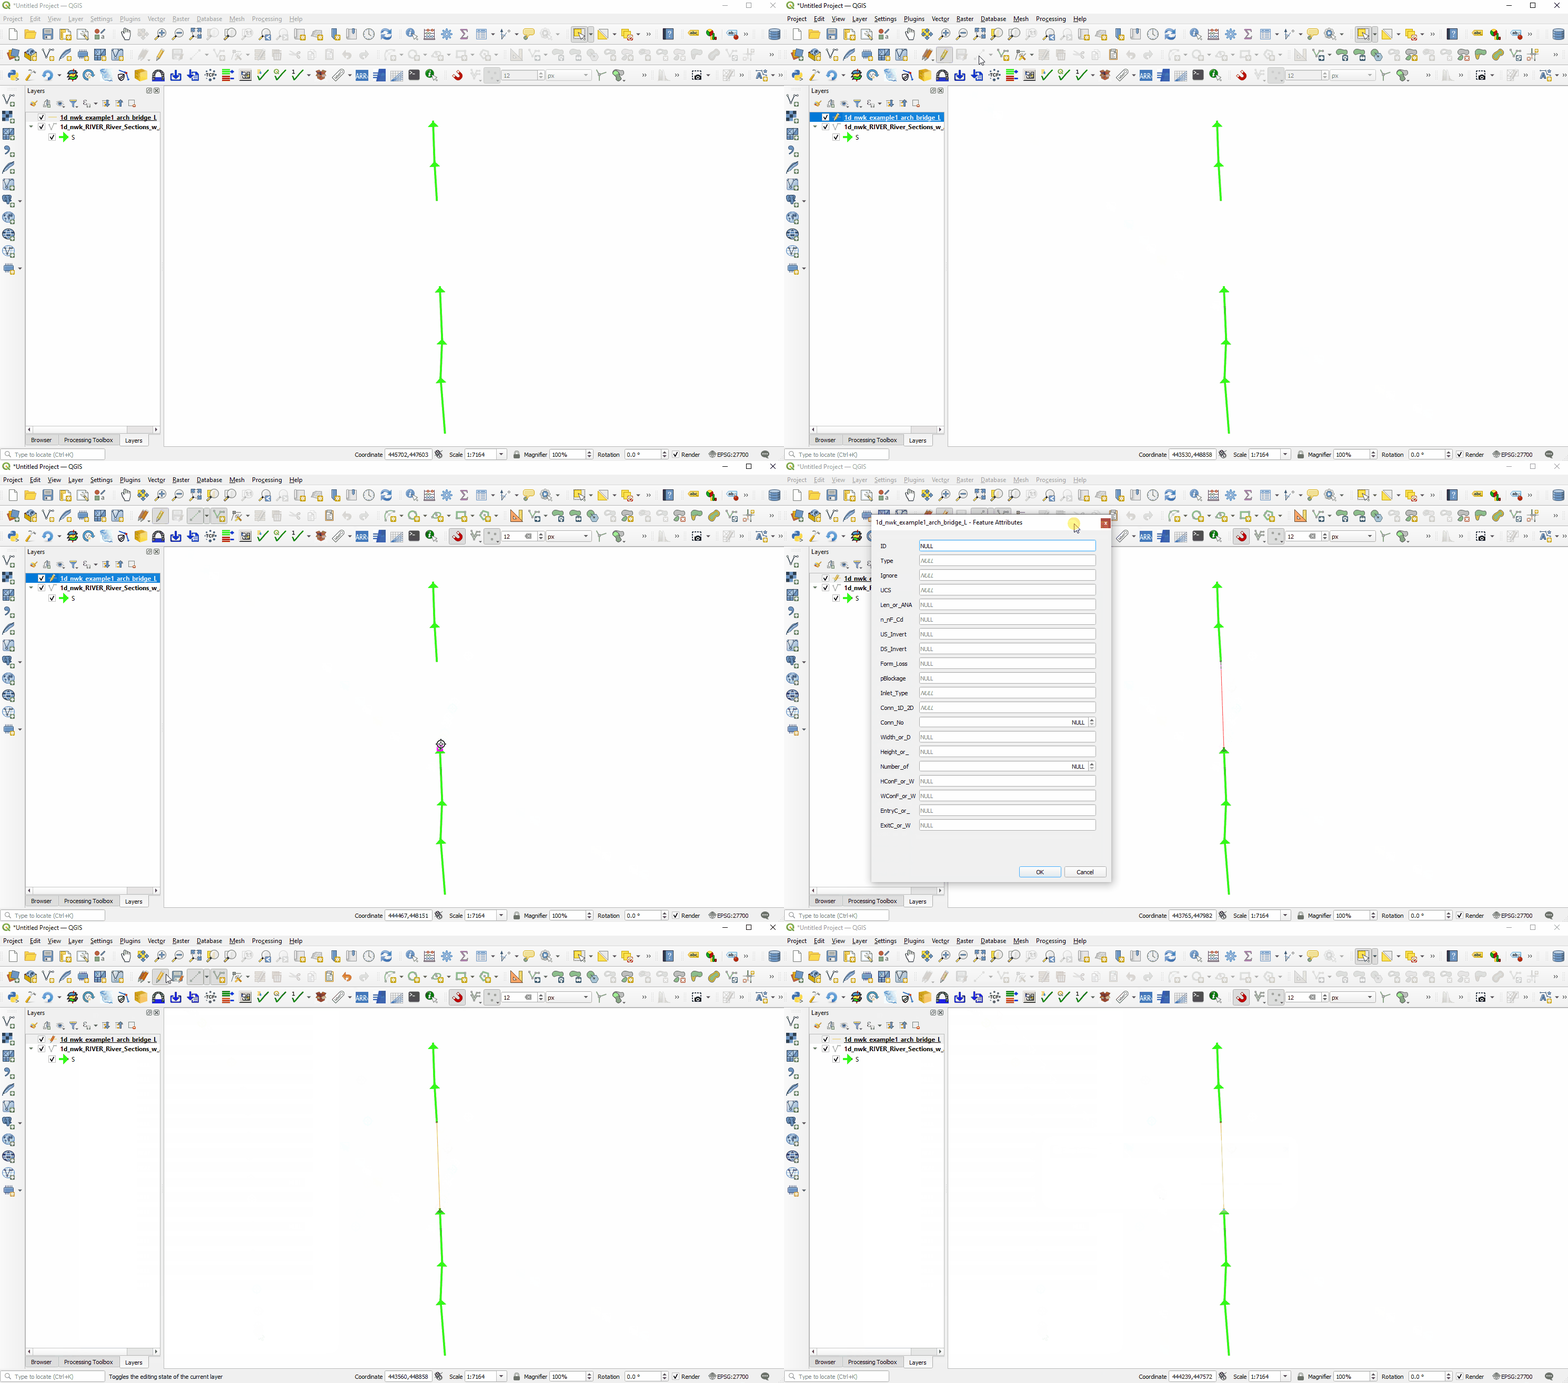
An existing 1d_nwk layer is required as an input into the tool. For this demonstration, a new 1d_nwk was created using the Import Empty Tool.
2. Draw Arch Bridge Channel
An existing arch bridge polyline is also required as an input into the tool. The polyline does not require any attributes to be filled out or completed, however the spatial geometry must already be present (the bridge must be inside a 1d_nwk layer type). In this example, open channels ('S' types) are already present and an arch bridge is drawn to connect the upstream reach to the downstream reach. Note: no attributes are populated in the newly created channel, an ID could be provided to make it slightly easier to find the arch bridge editor.
3. Populate the GIS Inputs
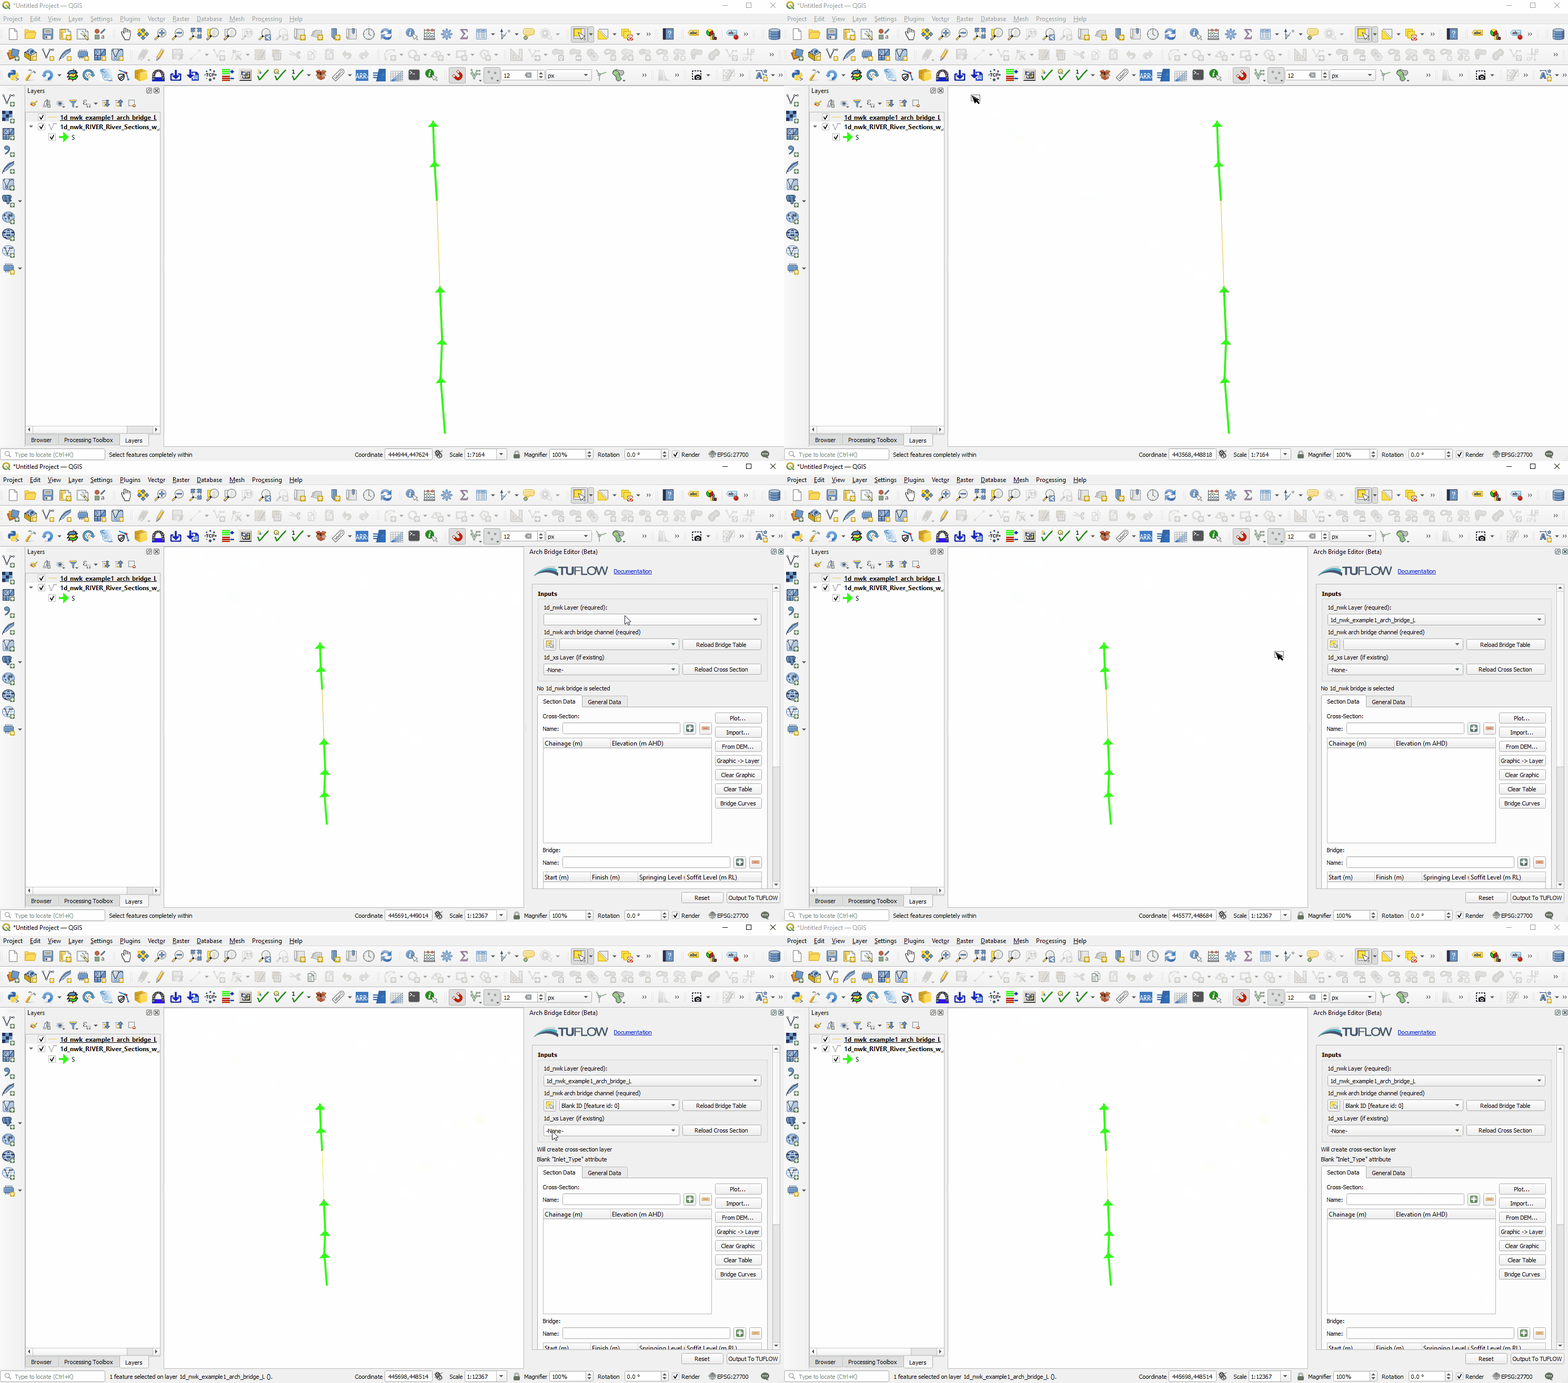
In this step, the arch bridge editor is opened and the GIS inputs are populated. The first dropdown will point to the 1d_nwk layer created in Step 1. The 'Select Feature on Map' tool is used to select the newly drawn arch bridge polyline in Step 2. Note: the 1d_xs layer dropdown box is left as "-None-" so that the tool will automatically create the 1d_xs layer. This information is provided in the status text located below the GIS inputs. The status text indicates that a 1d_xs layer will be created and that the "Inlet_Type" attribute is blank (this is where the bridge data CSV is referenced). If the "Inlet_Type" wasn't blank, the editor would try and populate the bridge table.
4. Import Bridge Information
The bridge data is imported from an existing Flood Modeller .dat file in this step. This will populate the cross-channel and bridge tables, as well fill-in the name attributes in the editor. Note: data in the "General Data" tab is also populated based on the imported bridge. Once the tables are populated with the imported data, the "Plot" tool can be used to visualise the data.
