Unused files
Jump to navigation
Jump to search
The following files exist but are not embedded in any page. Please note that other websites may link to a file with a direct URL, and so may still be listed here despite being in active use.
Showing below up to 50 results in range #101 to #150.
-
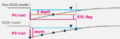 Pit Flow Capture.PNG 714 × 235; 26 KB
-
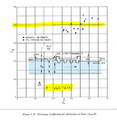 Bridge Discharge Coefficient.png 507 × 518; 89 KB
-
 LoadResult MapOutput.gif 1,080 × 609; 1.39 MB
-
 LoadResults TimeSeries.gif 1,080 × 609; 1.43 MB
-
 LoadResults TimeSeriesFM img.PNG 620 × 440; 76 KB
-
 LoadResults TimeSeriesFM.gif 1,080 × 609; 1.94 MB
-
 Import HydProperties.gif 1,080 × 609; 1.99 MB
-
 Import CrossSections.gif 1,080 × 609; 1.34 MB
-
 MapOutputs ChangingResults img.PNG 524 × 203; 26 KB
-
 MapOuputs ChangingResults.gif 1,080 × 609; 1.25 MB
-
 MapOutputs ChangingResultTypes.gif 1,080 × 609; 1.48 MB
-
 MapOutputs DisplayMaximum.gif 1,080 × 609; 1.32 MB
-
 MapOutputs DisplayingVectors.gif 1,080 × 609; 1.88 MB
-
 MapOutputs StyleScalarType img.PNG 1,275 × 638; 204 KB
-
 MapOutputs StyleScalarType.gif 1,080 × 609; 1.78 MB
-
 MapOutputs StyleVectorType img1.PNG 709 × 632; 79 KB
-
 MapOutputs StyleVectorType img2.PNG 647 × 597; 77 KB
-
 MapOutputs StyleVectorType img3.PNG 1,162 × 468; 330 KB
-
 MapOutputs StyleVectorType img4.PNG 1,216 × 543; 427 KB
-
 MapOutputs StyleVectorType gif1.gif 1,080 × 609; 2 MB
-
 MapOutputs StyleVectorType gif2.gif 1,080 × 609; 1.84 MB
-
 MapOutputs SaveDefaultStyle.gif 1,080 × 609; 1.76 MB
-
 MapOutputs DisplayMesh img1.PNG 413 × 230; 17 KB
-
 MapOutputs DisplayMesh img2.PNG 591 × 316; 53 KB
-
 MapOutputs DisplayMesh img3.PNG 668 × 608; 57 KB
-
 MapOutputs DisplayMesh.gif 1,080 × 609; 1.85 MB
-
 TUFLOW Viewer In Toolbar.PNG 585 × 151; 22 KB
-
 TimeSeries EstryResults.gif 1,080 × 609; 1.23 MB
-
 TimeSeries EstryResults2013.gif 1,080 × 609; 1.17 MB
-
 TimeSeries FMResults.gif 1,080 × 609; 1.75 MB
-
 Plotting Toolbar TimeSeries.PNG 393 × 138; 21 KB
-
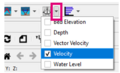
 Plotting Toolbar TimeSeries Dropdown.PNG 273 × 155; 20 KB
-
 Plotting MapOutput TimeSeries.gif 1,080 × 609; 1.34 MB
-
 MapOutputs 3Dto2DDepthAvg.PNG 1,220 × 623; 144 KB
-
 MapOutputs 3Dto2DDepthAvg.gif 1,080 × 609; 1.8 MB
-
 Plotting Toolbar CrossSection.PNG 393 × 136; 21 KB
-
 Plotting Toolbar CrossSection Dropdown.PNG 276 × 152; 20 KB
-
 Plotting MapOutput CrossSection.gif 1,080 × 609; 1.47 MB
-
 Plotting MapOutput LongPlot.gif 1,080 × 609; 1.83 MB
-
 Plotting Toolbar Flux.PNG 392 × 136; 21 KB
-
 Plotting MapOutput Flow.gif 1,080 × 609; 1.17 MB
-
 Plotting Toolbar CurtainPlot.PNG 389 × 142; 21 KB
-
 Plotting MapOutput CurtainPlot HPC.gif 1,080 × 609; 1.96 MB
-
 Plotting MapOutput CurtainPlot HPCwVec.gif 1,080 × 609; 1.95 MB
-
 Plotting Toolbar CurtainPlot Dropdown.PNG 273 × 165; 20 KB
-
 Plugin SCS Simulation Settings.png 413 × 127; 4 KB
-
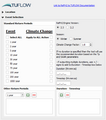 ReFH2 Event Selection.png 513 × 580; 22 KB
-
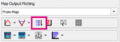
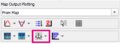
 Plotting From Map Multi.PNG 340 × 127; 17 KB
-
 Plotting From Map Multi TS.gif 1,080 × 609; 1.22 MB
-
 Plotting From Map Multi CS.gif 1,080 × 609; 1.49 MB


