Uncategorized files
Jump to navigation
Jump to search
Showing below up to 50 results in range #2,901 to #2,950.
-
 Plotting From Layer Selection.PNG 377 × 140; 21 KB
-
 Plotting From Layer Selection.gif 1,080 × 609; 1.27 MB
-
 Plotting From Map Multi.PNG 340 × 127; 17 KB
-
 Plotting From Map Multi CS.gif 1,080 × 609; 1.49 MB
-
 Plotting From Map Multi TS.gif 1,080 × 609; 1.22 MB
-
 Plotting GridLines Example.gif 1,080 × 609; 1.56 MB
-
 Plotting GridLines Menu.PNG 223 × 347; 41 KB
-
 Plotting HeaderImg.PNG 1,555 × 853; 843 KB
-
 Plotting Legend Custom Position 0.5 1.1.PNG 775 × 338; 23 KB
-
 Plotting Legend Custom Position 0 0.PNG 775 × 338; 25 KB
-
 Plotting Legend Custom Position 1 1.PNG 775 × 338; 23 KB
-
 Plotting Legend Default Positions.PNG 830 × 345; 41 KB
-
 Plotting Legend FontSize Menu.PNG 240 × 315; 30 KB
-
 Plotting Legend Menu.PNG 374 × 332; 48 KB
-
 Plotting Legend Orientation Example.gif 1,080 × 609; 1.43 MB
-
 Plotting Legend Orientation Menu.PNG 240 × 315; 29 KB
-
 Plotting Legend Position Example.gif 1,080 × 609; 1.7 MB
-
 Plotting Legend Position Menu.PNG 239 × 323; 29 KB
-
 Plotting LiveCursorTracking Example.gif 1,080 × 609; 1.58 MB
-
 Plotting MapOutput CrossSection.gif 1,080 × 609; 1.47 MB
-
 Plotting MapOutput CurtainPlot FV.gif 1,080 × 609; 1.96 MB
-
 Plotting MapOutput CurtainPlot HPC.gif 1,080 × 609; 1.96 MB
-
 Plotting MapOutput CurtainPlot HPCwVec.gif 1,080 × 609; 1.95 MB
-
 Plotting MapOutput CurtainPlot VerticalVelocity.gif 1,079 × 571; 475 KB
-
 Plotting MapOutput DepAv CrossSection.gif 1,080 × 609; 1.73 MB
-
 Plotting MapOutput DepAv TimeSeries.gif 1,080 × 609; 1.71 MB
-
 Plotting MapOutput Flow.gif 1,080 × 609; 1.17 MB
-
 Plotting MapOutput LongPlot.gif 1,080 × 609; 1.83 MB
-
 Plotting MapOutput TimeSeries.gif 1,080 × 609; 1.34 MB
-
 Plotting MapOutput VerticalMesh Example.gif 1,080 × 609; 1.38 MB
-
 Plotting MapOutput VerticalProfile.gif 1,080 × 609; 1.8 MB
-
 Plotting MapOutput VerticalProfile Interpolated.png 849 × 355; 21 KB
-
 Plotting MapOutput VerticalProfile Uninterpolated.png 849 × 355; 14 KB
-
 Plotting MapOutputs VerticalMesh Menu.PNG 204 × 348; 38 KB
-
 Plotting MedianMean Event Selection Example.gif 1,080 × 609; 1.77 MB
-
 Plotting MedianMean Legend.PNG 925 × 377; 157 KB
-
 Plotting MedianMean Menu.PNG 453 × 95; 20 KB
-
 Plotting Navigation Example.gif 720 × 405; 1.68 MB
-
 Plotting Navigation ForwardBack Icon.PNG 51 × 26; 708 bytes
-
 Plotting Navigation Home Icon.PNG 24 × 24; 832 bytes
-
 Plotting Navigation Pan Icon.PNG 31 × 26; 901 bytes
-
 Plotting Navigation Querying Plot.PNG 362 × 129; 24 KB
-
 Plotting Navigation Zoom Icon.PNG 27 × 25; 929 bytes
-
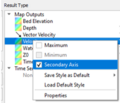 Plotting Secondary Axis Context Menu.PNG 216 × 185; 24 KB
-
 Plotting Secondary Axis Example.gif 1,080 × 609; 1.36 MB
-
 Plotting Secondary Axis Flux.PNG 321 × 119; 17 KB
-
 Plotting Settings ARR Mean Event Selection.PNG 340 × 496; 70 KB
-
 Plotting Settings VerticalProfile Interpolate.PNG 343 × 499; 70 KB
-
 Plotting Show Current Time Example.gif 1,080 × 609; 906 KB
-
 Plotting Show Selected Elements Dialog.PNG 310 × 230; 7 KB


