TUFLOW Viewer - Customising The Plot Legend
Tool Description
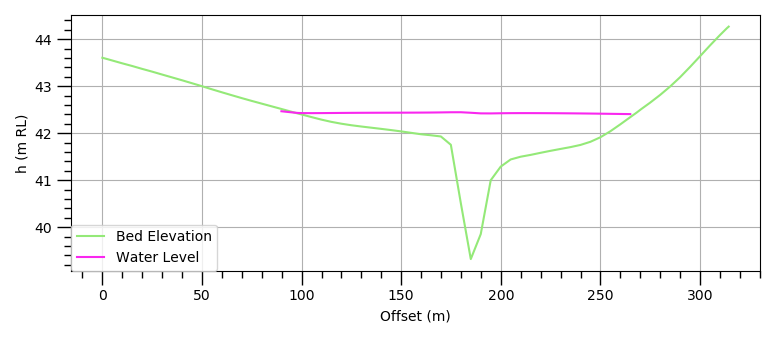
The plot legend can be re-positioned, re-orientated, turned off completely, or the font size updated by the user. Each plot (i.e. Time Series, Cross-Section / Long Profile, etc) has independent legend settings.
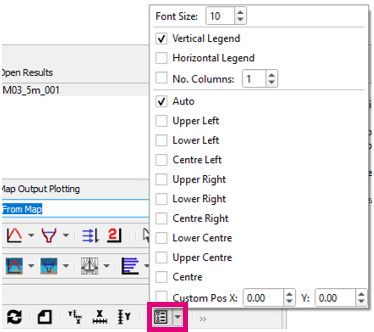
The legend can be toggled on/off by clicking the Legend button. The positioning and orientation options can be accessed by using the down-arrow on the right-hand side of the button.
Customising The Legend Position
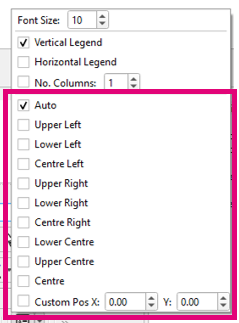
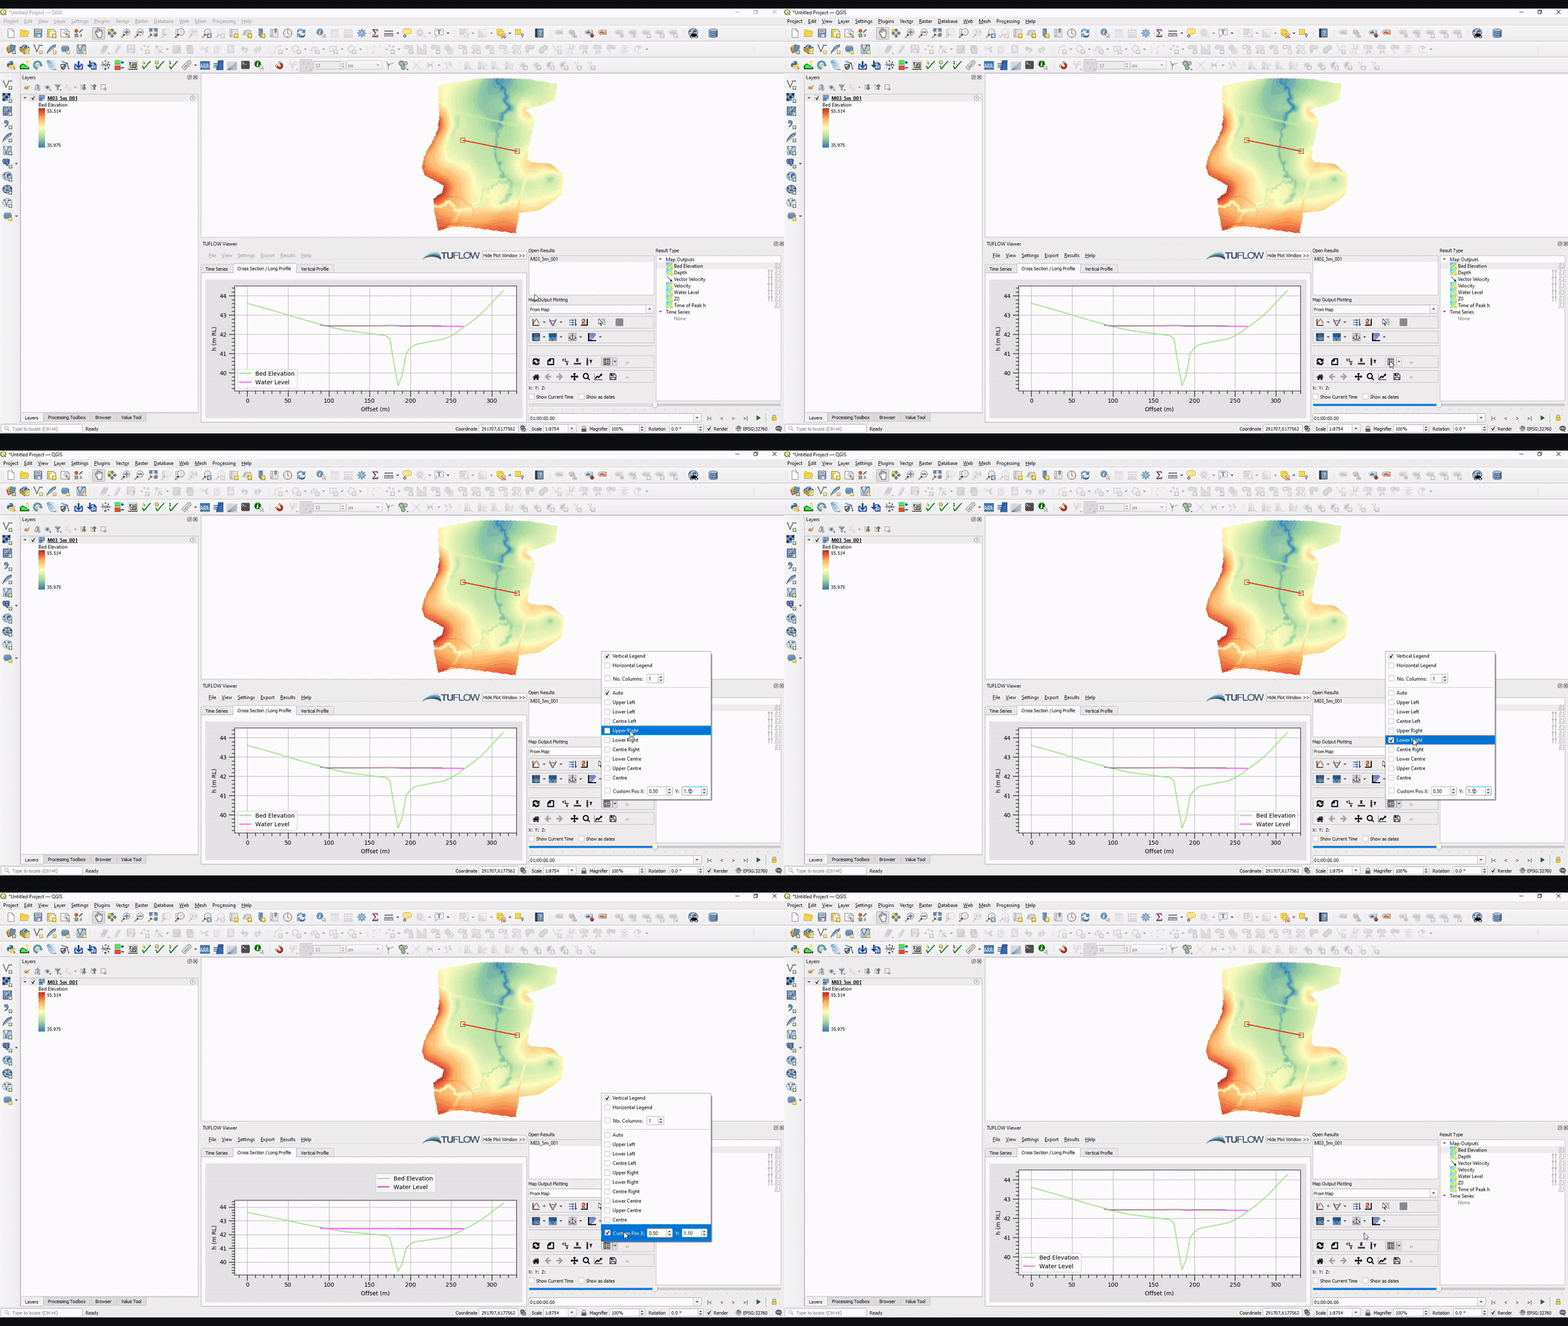
The legend position can be changed by either choosing one of the pre-defined positions, or by inputing a custom position.
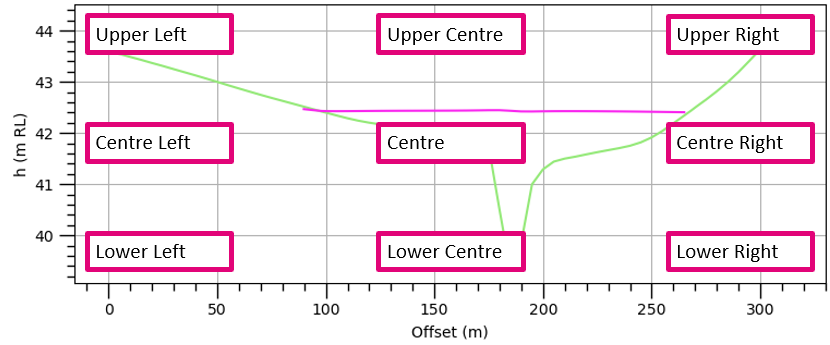
The default positions are shown below. The Auto option is dynamic and attempts to choose the best position.
The Custom Position option allows the user to manually specify the exact location of the legend. The convention is as follows:
- Position X: 0.0, Y: 0.0 = the bottom left corner of the plot window
- Position X: 1.0, Y: 1.0 = the top right corner of the plot window
- The position is where the bottom-left of the legend is placed (i.e. the anchor point of the legend is the bottom-left)
- The position can be below zero and greater than one (this will place the legend outside the plot)
Examples:
Position X:0, Y:0
Position X:1, Y:1
Position X:0.5, Y:1.1
Customising The Legend Orientation
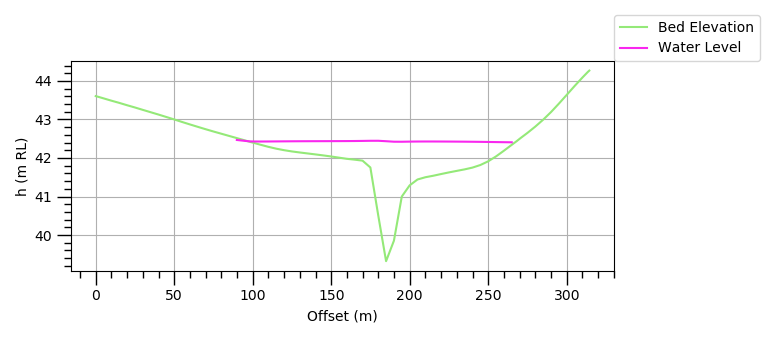
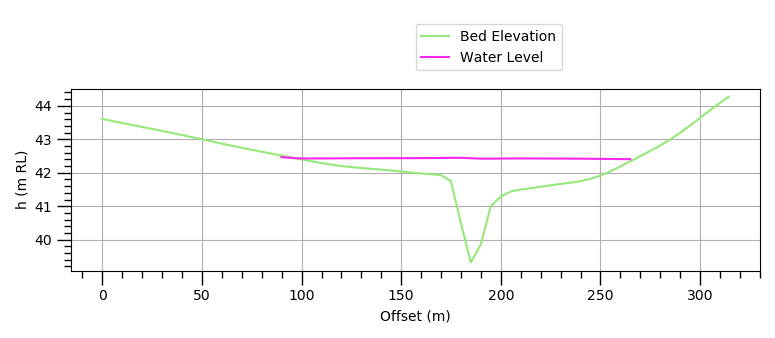
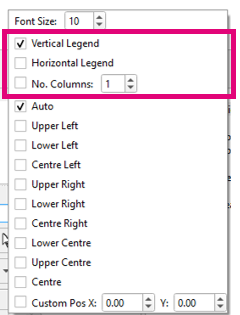
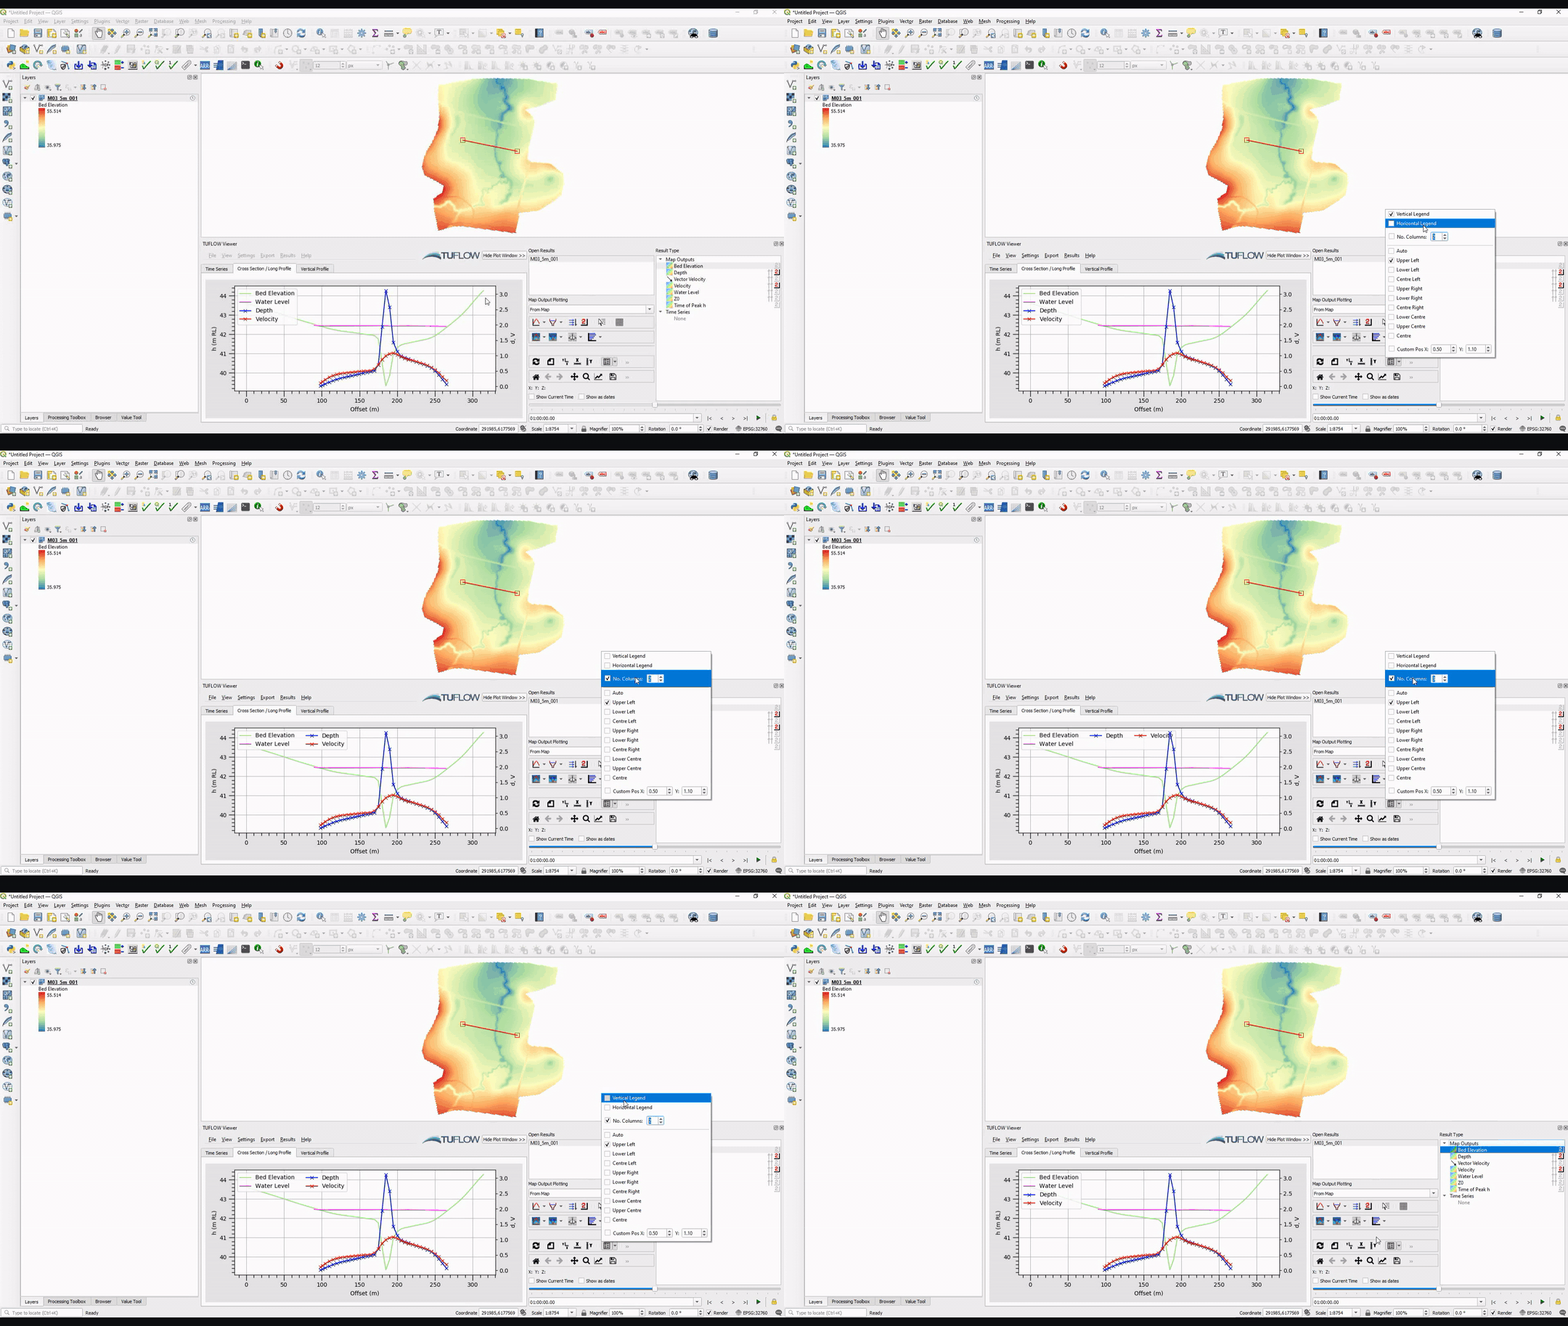
The legend can be orientated veritcally (default), horizontally, or the user can specify how many columns to split the legend over.
Changing The Font Size
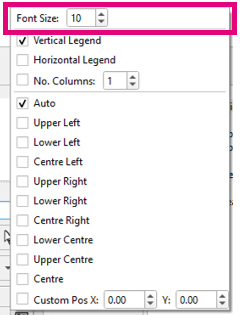
The font size can be changed by updating the Font Size option in the legend menu.
