TUFLOW Viewer - Navigating And Querying The Plot
Tool Description
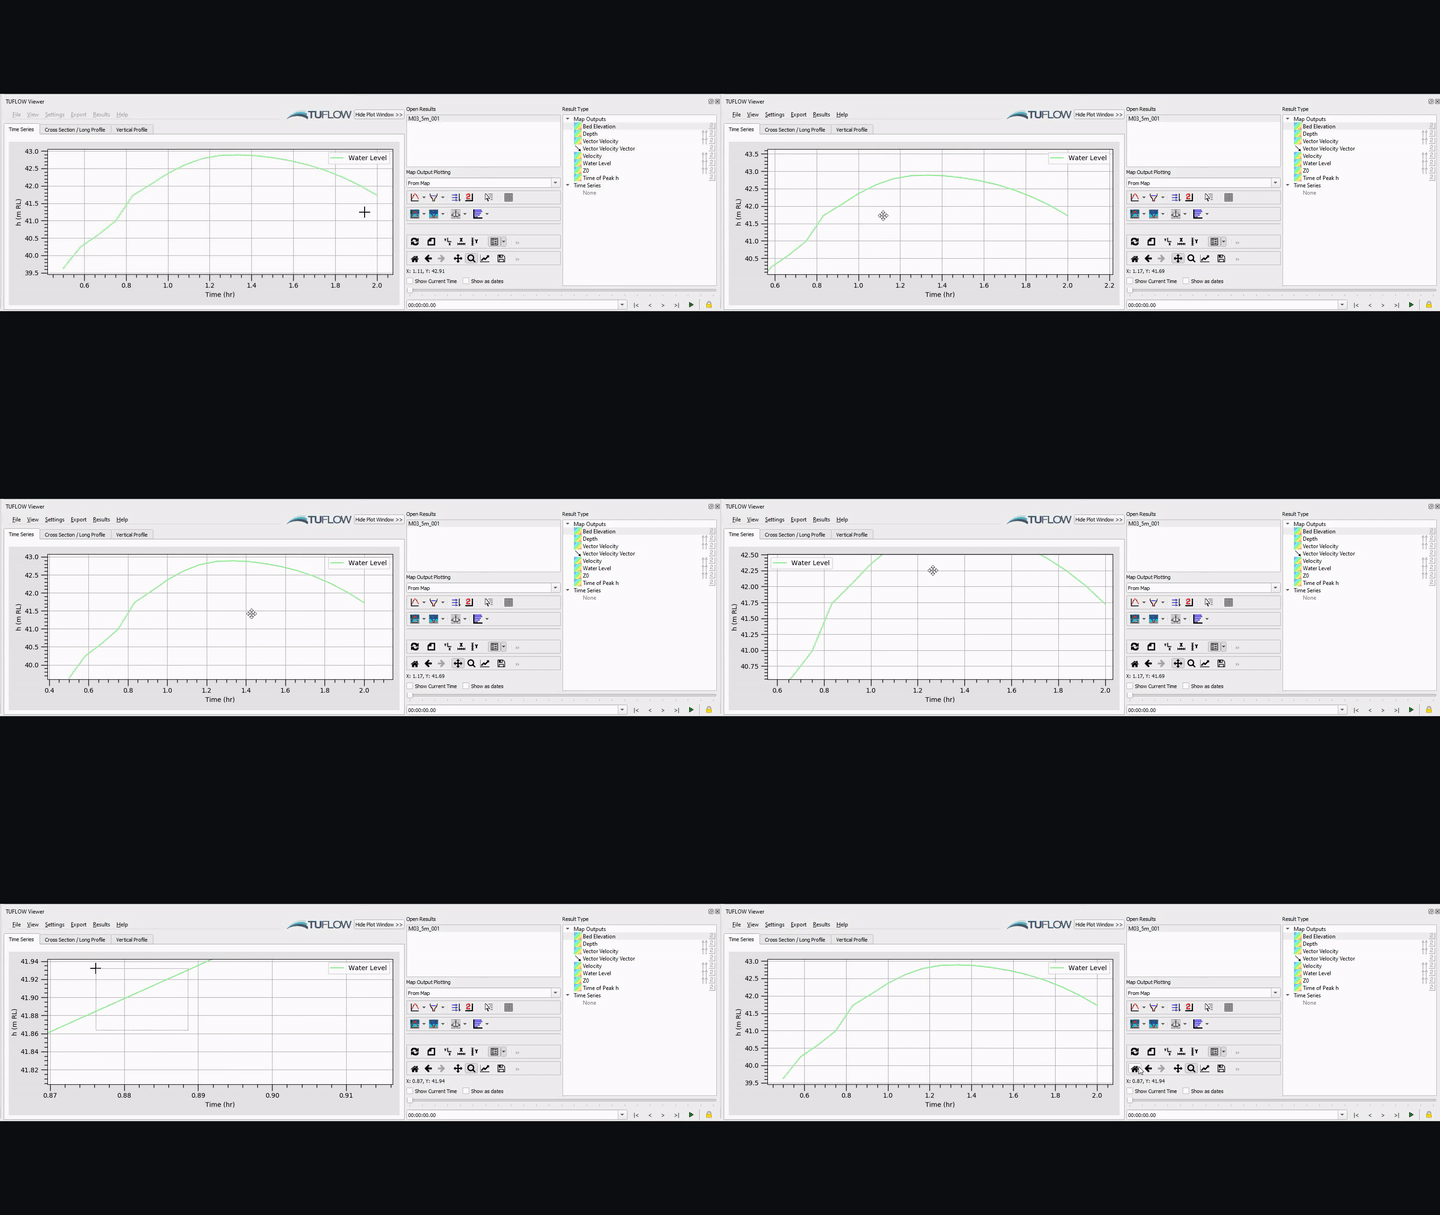
The plot window can be changed by using both the pan tool or the zoom tool
.
- Using the pan tool the user can use left-click to change the absolute plot extents while keeping the relative extents the same (i.e. scale is not changed). Using right-click will change both the extents and the scale.
- Using the zoom tool the user can zoom-in using the left mouse button and zoom-out using the right mouse button
The forward and back buttons can be used to navigate between previous and subsequent view extents. And the home button
will reset the view back to the original extent.
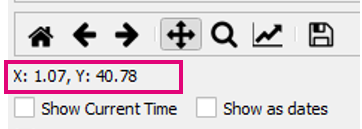
The plot can also be queried by left-clicking a location. The plot value is displayed underneath the plotting toolbar. If a secondary axis is present, the value for both the primary and secondary axis will be listed. If a curtain plot is clicked, the scalar value of the location will be presented using Z. Note: the values are from the exact location of the cursor when the click occurred, it does not snap to the nearest plot object.
Examples
Links
Similar Tools
- Showing Selected Elements and Selecting Sub-Sets
- Using a Secondary Axis
- Using a Date Axis
- Showing the Current Time
- Customising The Legend
- Customising The Plotting Styles
- Customising The Plot Axes
- Toggling Plot Grid Lines
- Importing a Custom Colour Ramp For The Curtain Plot
- Viewing the Vertical Mesh

