Tute M05 Calculate Afflux MapInfo Archive
Introduction
In this page we will use MapInfo / Vertical Mapper to compare the developed and existing case flood levels.
Method
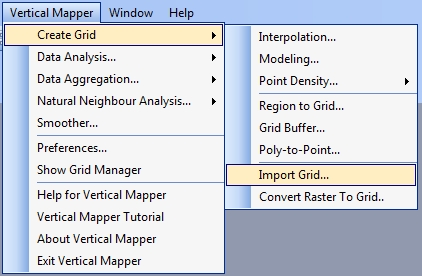
- The results grids first need to be imported into Vertical Mapper before we can perform a grid calculation. To do this from the menu select Vertical Mapper >> Create Grid >> Import Grid.
- Navigate to the TUFLOW\Results\M05\2D\ folder and select both the M05_5m_dev_001_hMax.asc and M05_5m_exg_001_hMax.asc grids.
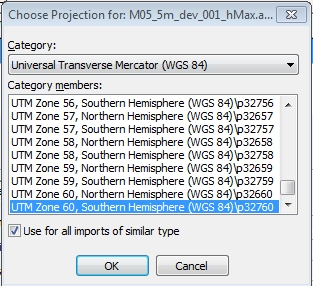
- When prompted for the projection, select Universal Transverse Mercator (WGS 84) from the category drop list and then select UTM Zone 60, Southern Hemisphere (WGS84)\p32760. Select the option to Use for all imports of similar type.
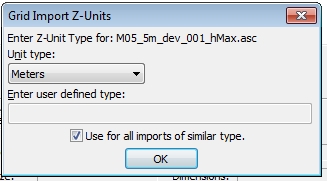
- Set the Z units to Metres and ensure the Use for all imports of similar type is checked.
- Select OK and Vertical Mapper will import both grids.
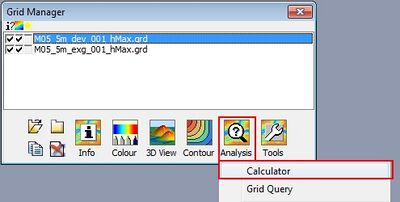
- From the Vertical Mapper Grid Manager select Analysis >> Calculator
TIP: If this is not visible, select Vertical Mapper >> Show Grid Manager from the menu item.
- Set the expression to be the developed case minus (-) the existing case.
-
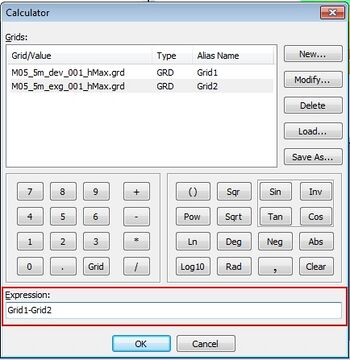
- Set the output name to M05_5m_001_dhMax.tab and the Vertical Units to "Metres".
TIP: If you would prefer the impacts in millimetres the expression can be evaluated as (Grid1 - Grid2)*1000. - The resulting grid shows the impacts where both the developed and existing case scenarios were wet.
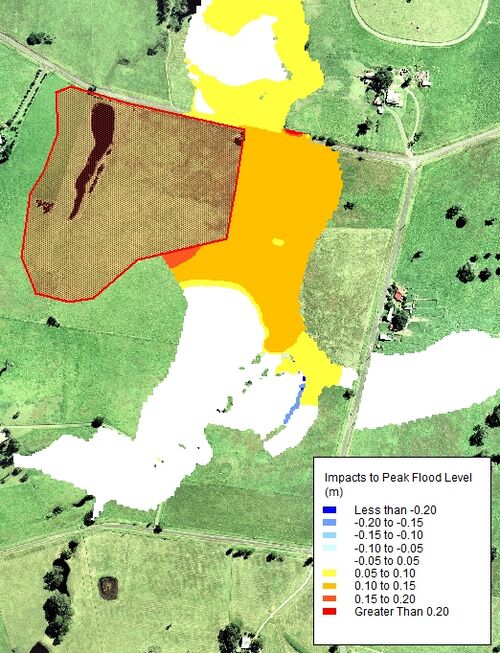
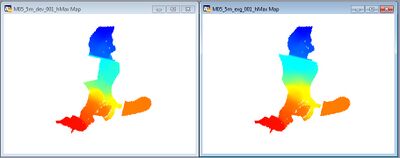
- This can be coloured using the Colour options in the Vertical Mapper Grid Manager. These can also be contoured with the Contour options in the Vertical Mapper Grid Manager. The contoured results are shown below.
Conclusion
MapInfo / Vertical Mapper has been used to calculate the flood afflux. Please return to the Module 5.