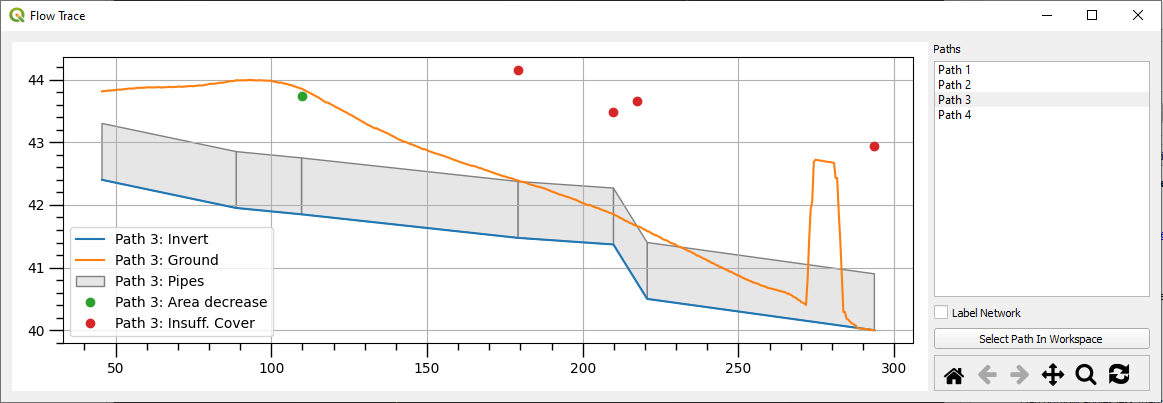
1D Integrity Tool - Flow Trace - Long Plot
Overview
The long plot is an option on the flow trace tool within the 1D integrity toolset. If selected, longitudinal plots of the 1D branches selected by the flow trace tool will be shown in a new plot window once the flow trace tool is finished running.

Visualisation Features
Branch Selection
Branch selection can be toggled on the right-hand side in the 'Paths' list. A branch (or called 'path' in the long plot) is a unique flow trace path from the selected pipe up to a point where it can no longer find anymore 1D channels to traverse upstream. Where the 1D system has multiple incoming or outgoing pipes from a node, a new branch will be created to account for the diverging flow trace path.
Multiple branches can be viewed in the long plot simultaneously.
Finding the Current Branch in QGIS
Users can click Select Path in Workspace to show the current paths selected in the long plot within QGIS. This option will show the path by selecting these features in QGIS and deselecting other features in the 1D network. Hovering the cursor over a given channel will also highlight (in red) the location of that channel in the QGIS window. Additional information on navigating and finding channels and branches is also given below in Navigation Features.
Channel Labelling
Channel IDs can be toggled on/off in the long plot using the Label Network checkbox.
Additional Information
Hovering the cursor over channels in the long plot will give additional information, such as channel type, number of, and dimensions. Similarly when hovering the cursor over any of the continuity flags, additional information is given such as continuity flag type, and information on the specific continuity error e.g. for an area check flag, information will be given on incoming and outgoing area.
TODO