Difference between revisions of "FM Tute M01 QGIS 1D2D Banks"
Jump to navigation
Jump to search
Andrew.Sims (talk | contribs) (Created page with "=Method= <li>Import in an empty 2d_bc_empty.shp layer from within the TUFLOW\model\gis\empty folder and save as 2d_bc_FMT_M01_HX_001.gis</li> <li>Open the 1D_2D_HX_Links.shp G...") |
Tuflowduncan (talk | contribs) (→Method) |
||
| (19 intermediate revisions by 4 users not shown) | |||
| Line 1: | Line 1: | ||
| + | <ol> | ||
| + | =Introduction= | ||
| + | In this section we will define the bank elevations of the watercourse. These are the elevations of the 1D/2D boundary cells that link the 1D Flood Modeller watercourse to the 2D TUFLOW floodplain.<br> | ||
| + | Note that it is these cell elevations that determine whether water spills from the 1D Flood Modeller domain into the 2D TUFLOW domain. The bank elevations of the Flood Modeller 1D cross-sections do not control the spill. | ||
| + | |||
=Method= | =Method= | ||
| − | <li>Import in an empty | + | <li>Import in an empty <b>2d_bc_empty_P.shp</b> layer from within the FMT_tutorial\FMT_M01\TUFLOW\model\gis\empty folder.</li> |
| − | <li>Open the | + | <li>Save the layer as <b>2d_bc_FMT_M01_HX_001_P.shp</b> in the FMT_tutorial\FMT_M01\TUFLOW\model\gis folder. </li> |
| − | <li>Interrogate one of the | + | <li>Open the <b>1D_2D_Points_P.shp</b> GIS layer from Module_Data\Module_01\gis folder. Select all objects from within this layer, copy and paste into <b>2d_bc_FMT_M01_HX_001_P.SHP </b>. </li> |
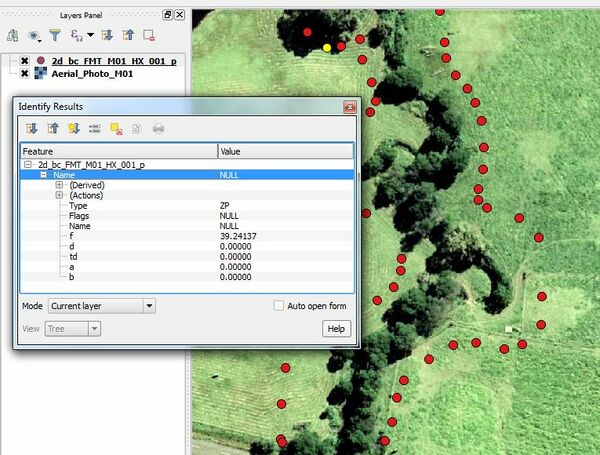
| − | <li> | + | <li>Interrogate one of the digitised points and inspect the attributes. The ‘type’ attribute is ‘ZP’ to denote that it is a z-point which will define the elevation on the banks. The ‘f’ attribute is the elevation of the bank link in mAOD. </li> |
| − | + | <li>Now add the layer <b>2d_bc_FMT_M01_HX_001_L.SHP</b> from the '''FMT_tutorial\FMT_M01\TUFLOW\model\gis''' folder created in the previous step. Note that all the 'ZP' points created in the layer <b>2d_bc_FMT_M01_HX_001_P.SHP</b> are snapped to vertices of the layer <b>2d_bc_FMT_M01_HX_001_L.SHP</b>. This is because these two layers work together to define the bank locations and crest elevations. The layer <b>2d_bc_FMT_M01_HX_001_L.SHP</b> defines the location and the layer <b>2d_bc_FMT_HX_001_P.SHP</b> defines the elevations. | |
<br> | <br> | ||
| − | |||
| − | |||
| − | |||
| − | + | [[File:FMT_1D2D_Banks.JPG|600px]] | |
| − | |||
| − | <li> | + | <li>Save the file.</li> |
| − | + | <div style="background-color: #D6E9E0; margin: 20px; text-align: center; | |
| − | + | border: 5px solid #1ABDC9"> | |
| − | | | + | <p style="font-weight: bold; color: #E20177">Key Tip!</p> |
| + | <p> The bank (1D/2D boundary) elevations may also be defined using a 2d_zsh layer or other 3D breakline layer. The advantage of using a 2d_bc layer is it ensures the boundary cell elevations are raised and not that of adjacent cells. </p> | ||
| + | </div> | ||
| + | Please return to the [[Flood_Modeller_Tutorial_Module01#Deactivate_2D_cells|Flood Modeller Tutorial Model]]. | ||
| − | + | </ol> | |
Latest revision as of 23:24, 7 December 2018
- Import in an empty 2d_bc_empty_P.shp layer from within the FMT_tutorial\FMT_M01\TUFLOW\model\gis\empty folder.
- Save the layer as 2d_bc_FMT_M01_HX_001_P.shp in the FMT_tutorial\FMT_M01\TUFLOW\model\gis folder.
- Open the 1D_2D_Points_P.shp GIS layer from Module_Data\Module_01\gis folder. Select all objects from within this layer, copy and paste into 2d_bc_FMT_M01_HX_001_P.SHP .
- Interrogate one of the digitised points and inspect the attributes. The ‘type’ attribute is ‘ZP’ to denote that it is a z-point which will define the elevation on the banks. The ‘f’ attribute is the elevation of the bank link in mAOD.
- Now add the layer 2d_bc_FMT_M01_HX_001_L.SHP from the FMT_tutorial\FMT_M01\TUFLOW\model\gis folder created in the previous step. Note that all the 'ZP' points created in the layer 2d_bc_FMT_M01_HX_001_P.SHP are snapped to vertices of the layer 2d_bc_FMT_M01_HX_001_L.SHP. This is because these two layers work together to define the bank locations and crest elevations. The layer 2d_bc_FMT_M01_HX_001_L.SHP defines the location and the layer 2d_bc_FMT_HX_001_P.SHP defines the elevations.
- Save the file.
Introduction
In this section we will define the bank elevations of the watercourse. These are the elevations of the 1D/2D boundary cells that link the 1D Flood Modeller watercourse to the 2D TUFLOW floodplain.
Note that it is these cell elevations that determine whether water spills from the 1D Flood Modeller domain into the 2D TUFLOW domain. The bank elevations of the Flood Modeller 1D cross-sections do not control the spill.
Method

Key Tip!
The bank (1D/2D boundary) elevations may also be defined using a 2d_zsh layer or other 3D breakline layer. The advantage of using a 2d_bc layer is it ensures the boundary cell elevations are raised and not that of adjacent cells.
Please return to the Flood Modeller Tutorial Model.