M02 MI 1D Results Archive
Revision as of 14:23, 6 January 2023 by ElizaCollison (talk | contribs) (Created page with "<ol> =Introduction= In this page we will review the GIS outputs for the 1D model. We will look at the maximums (flow, level and velocity) as well as the time-series. These are...")
- From the TUFLOW\results\M02\1d\ folder import the following files:
- M02_5m_001_1d_mmH.mif
- M02_5m_001_1d_mmQ.mif
- M02_5m_001_1d_mmV.mif
Tip: for those with miTools, use the batch import function.
- Add the files to the map window, and navigate to one of the culvert locations.
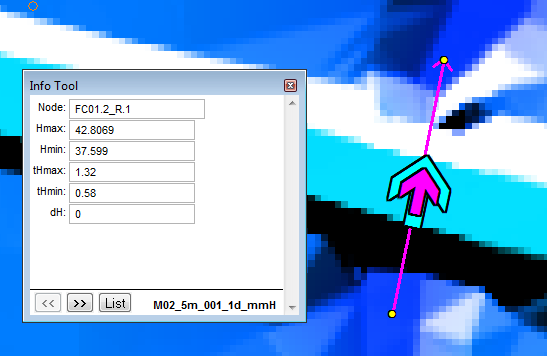
- At both ends of the culverts there is a yellow point which contains the water level results. Use the info tool to interrogate the results, the following information is displayed for the node:
- Node ID (Node)
- Maximum Water Level (Hmax)
- Minimum Water Level (Hmin)
- Time of max water level (tHmax)
- Time of min water level (tHmin)
- Change in water level from upstream node (dH)
- Import the M02_5m_001_TS.mif file from the TUFLOW\results\M02\1d\ folder and add to the current map window.
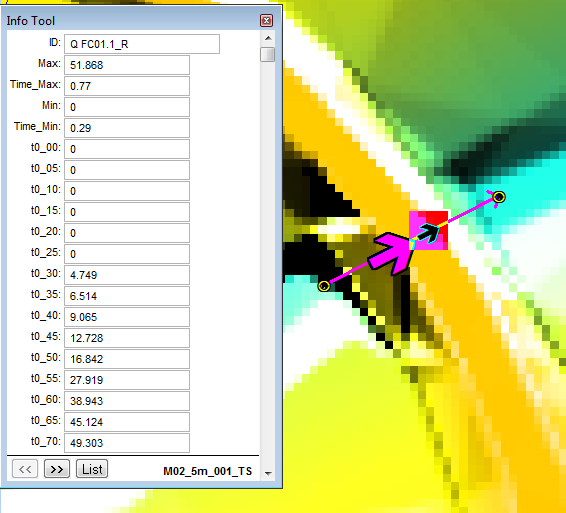
- Zoom to one of the culvert locations, there should be four objects in the M02_5m_001_TS layer, the nodes at the end of the culvert contains water level information, the light blue arrow contains flow information and the purple arrow velocity information.
- Click the information tool on one of the results locations, in the information window the first column contains the ID, the next four columns contain the maximum and minimum results, after this the value at each output interval is displayed. For example t0_05 contains the output for time = 0.05 hours (3 minutes / 180 seconds).
-
These values are also outputted in .csv file format so the date can be viewed in Excel. We review this in the next section.
- To do this select the desired results type and location(s) (multiple results can be selected).
- Select the "Chart Selected TS Items" options from the miTool bar, this is selected on the image below.
- A graph of the results should be displayed in a new window, as shown below. Right click on the graph for the display options.
Introduction
In this page we will review the GIS outputs for the 1D model. We will look at the maximums (flow, level and velocity) as well as the time-series. These are described separately in the sections below.
Maximums

Time-series
Time-series outputs are written to the GIS format, MapInfo does not have a inbuilt method for visualising these results. Use of this output is described for usere with and without the miTools utility.
Without miTools

With miTools
For users with the miTools, the time varying data can be plotted within MapInfo.


Conclusion
MapInfo has been used to review the GIS outputs for the 1D culvert results. Return to the module 2 page, where the next step is to view the results in Excel.