M02 SMS 1D Results Archive
- From the TUFLOW\results\ folder open the following files:
- M02_5m_001_1d_mmH_P.mif
- M02_5m_001_1d_mmQ_P.mif
- M02_5m_001_1d_mmV_P.mif
- Navigate to one of the culvert locations.
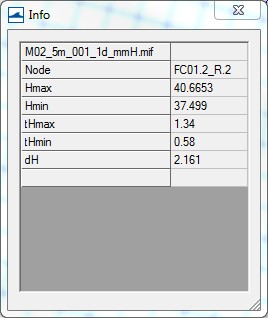
- At both ends of the culverts there is a point which contains the water level results, at the channel centre are points giving the flow and velocity results. Use the info tool to interrogate the results. The following information is displayed for the water level results:
- Node ID (Node)
- Maximum Water Level (Hmax)
- Minimum Water Level (Hmin)
- Time of max water level (tHmax)
- Time of min water level (tHmin)
- Change in water level from upstream node (dH)
- Select File->Open from the menu bar. Open the Results folder from the TUFLOW directory.
- Locate the M02_5m_001.xmdf.sup file and open it. The TUFLOW output is read into SMS in the form of a two-dimensional mesh.
- From the project explorer, turn off all Map Data, Scatter Data, and Cartesian Grid Data. Turn on and highlight the Mesh Data.
- Open the Display Options dialog. From the 2D Mesh tab, turn on elements, contours and vectors.
- Switch to the Contour Options tab and select Color Fill as the contour method.
- Click OK to close the Display Options dialog.
- The mesh will be contoured according to the selected dataset and time step.
Introduction
TUFLOW has several kinds of output. All the output data is found in a folder named results under the TUFLOW folder. Each file begins with the name of the simulation which generated the files. The files which have “_1d” after the simulation name are results for the 1D portions of the model. We will look at the maximums (flow, level and velocity) as well as the time-series data. These are described separately in the sections below.
Maximums

Time-series
In addition to the 1D solution files, the results folder contains a .2dm, .mat, .sup, and several .dat files. These are SMS files which contain a 2D mesh and accompanying solutions. To view the solution files from with SMS:

Conclusion
SMS has been used to review the GIS outputs for the 1D culvert results. Return to the module 2 page, where the next step is to view the results in Excel.