Difference between revisions of "TUFLOW SWMM Tutorial M02 Check QGIS"
| Line 23: | Line 23: | ||
<li>When prompted by QGIS, select 'Add Layers to open all layers within '''TS02_5m_001_swmm_check.gpkg'''. By default, all items in the available list should have been selected. | <li>When prompted by QGIS, select 'Add Layers to open all layers within '''TS02_5m_001_swmm_check.gpkg'''. By default, all items in the available list should have been selected. | ||
<br><br> | <br><br> | ||
| − | {{Video|name=|width=1235}} | + | {{Video|name=Animation_TS2_Check_01a.mp4|width=1235}} |
<br> | <br> | ||
<li>Manual Data Review (Optional): Review the '''Link--Conduits''', '''Nodes--Junctions''' and '''Node--Outfalls''' information to verify the data matches the input values. This data represents the 1D pipe network details. | <li>Manual Data Review (Optional): Review the '''Link--Conduits''', '''Nodes--Junctions''' and '''Node--Outfalls''' information to verify the data matches the input values. This data represents the 1D pipe network details. | ||
<br><br> | <br><br> | ||
| − | {{Video|name=|width=1235}} | + | {{Video|name=Animation_TS2_Check_02a.mp4|width=1235}} |
<br> | <br> | ||
<li>As the layers in '''TS02_5m_001_swmm_check.gpkg''' have been compared with the input layers, the input layers can be removed from the QGIS workspace. | <li>As the layers in '''TS02_5m_001_swmm_check.gpkg''' have been compared with the input layers, the input layers can be removed from the QGIS workspace. | ||
| Line 45: | Line 45: | ||
<li>In the QGIS Layers Panel, move the '''TS02_5m_001_DEM_Z.tif''' layer below the other check files so that the other datasets are visible. | <li>In the QGIS Layers Panel, move the '''TS02_5m_001_DEM_Z.tif''' layer below the other check files so that the other datasets are visible. | ||
<br><br> | <br><br> | ||
| − | {{Video|name=|width=1235}} | + | {{Video|name=Animation_TS2_Check_03a.mp4|width=1235}} |
<br> | <br> | ||
</ol> | </ol> | ||
| Line 77: | Line 77: | ||
<br><br> | <br><br> | ||
<ol> | <ol> | ||
| − | {{Video|name=|width=1235}} | + | {{Video|name=Animation_TS2_Check_04a.mp4|width=1235}} |
<br> | <br> | ||
</ol> | </ol> | ||
| Line 94: | Line 94: | ||
<li>A Flow Trace window will appear. It provides a 'long plot' of the long sections of the various upstream paths from the selected conduit, highlighting the areas of continuity failures. The plot should be consistent with the output GIS layer that is also generated by the flow trace tool. | <li>A Flow Trace window will appear. It provides a 'long plot' of the long sections of the various upstream paths from the selected conduit, highlighting the areas of continuity failures. The plot should be consistent with the output GIS layer that is also generated by the flow trace tool. | ||
<br><br> | <br><br> | ||
| − | {{Video|name=|width= | + | {{Video|name=Animation_TS2_Check_05a.mp4|width=1350}} |
<br> | <br> | ||
</ol> | </ol> | ||
| − | <br><br> | + | <br><br> |
| − | |||
| − | |||
| − | |||
| − | |||
| − | |||
| − | |||
| − | |||
| − | |||
| − | |||
| − | |||
| − | |||
| − | |||
| − | |||
| − | |||
| − | |||
| − | |||
| − | |||
| − | |||
{{Tips Navigation | {{Tips Navigation | ||
Revision as of 14:08, 13 December 2023
SWMM Check Files
Text Data
When TUFLOW runs SWMM, it can accommodate for multiple INP input files within the SWMM Control file. TUFLOW combines the input INP files into a single combined INP file for the simulation execution. The combined file TUFLOW uses is written to the TUFLOW\results folder.
- Open TS02_5m_001_swmm.inp from the TUFLOW\results folder into a text editor (for example Notepad++).
- Manual Data Review (Optional): Review the Junction, Outfall, Conduit, Losses, and XSections information in the text file.
QGIS Data
The QGIS TUFLOW Plugin SWMM Processing Tool, 'GeoPackage - Create from SWMM inp' can be used to create a spatial GeoPackage version of the INP data for post simulation review checking.
- In the Processing Toolbox, select 'GeoPackage - Create from SWMM inp'. This opens the dialog shown below.
- SWMM Input File (inp): Navigate to the TUFLOW\results folder and select TS02_5m_001_swmm.inp.
- CRS for GeoPackage: Click the drop down menu and select ‘Project CRS: EPSG:32760 - WGS 84 / UTM zone 60S’.
- SWMM Tags to ignore: leave blank.
- GeoPackage output filename: Click the ... and select 'Save to GeoPackage'. Navigate to the TUFLOW\check folder and set the GeoPackage output filename to TS02_5m_001_swmm_check.gpkg.
- Click 'Run'.
- Once the tool has finished, click 'Close'.
- TS02_5m_001_swmm_check.gpkg will now be available in the TUFLOW\check folder.
- In File Explorer, navigate to the TUFLOW\check folder and drag and drop TS02_5m_001_swmm_check.gpkg into QGIS.
- When prompted by QGIS, select 'Add Layers to open all layers within TS02_5m_001_swmm_check.gpkg. By default, all items in the available list should have been selected.
- Manual Data Review (Optional): Review the Link--Conduits, Nodes--Junctions and Node--Outfalls information to verify the data matches the input values. This data represents the 1D pipe network details.
- As the layers in TS02_5m_001_swmm_check.gpkg have been compared with the input layers, the input layers can be removed from the QGIS workspace.
TUFLOW Check Files
Open the TUFLOW check files:
- In File Explorer, navigate to the TUFLOW\check folder and drag and drop TS02_5m_001_Check.gpkg into QGIS.
- When prompted by QGIS, select TS02_5m_001_1d_to_2d_check_R and TS02_5m_001_swmm_pit_P (hold Ctrl to select multiple), then click 'Add Layers'.
- From the TUFLOW\check folder, drag and drop TS02_5m_001_DEM_Z.tif into QGIS.
- Use the 'Apply TUFLOW Styles to Open Layers'.
- Style TS02_5m_001_DEM_Z.tif (the topography check file) using the same hillshade styling as used for the input DEM model geometry.
- In the QGIS Layers Panel, right click DEM_Hillshade and select Styles > Copy Style.
- Right Click TS02_5m_001_DEM_Z.tif and select Styles > Paste Style.
- In the QGIS Layers Panel, move the TS02_5m_001_DEM_Z.tif layer below the other check files so that the other datasets are visible.
Manual Data Review (Optional): Compare the 2D check files information against the the 1D check files to verify the model design is as intended.
- How does the the pipe network invert elevations (Nodes--Junctions) compare to the the pit inlet (surface) elevations?
- Do the SWMM values for the 'Ysur' and 'Apond' at the pit inlet and closed junction locations vary? Do they match the values we specified when constructing the model?
TUFLOW Pipe Integrity Tool
Some of the optional manual data review exercises suggested in the previous sections can be easily carried out using the QGIS TUFLOW Plugin 'Pipe Integrity Toolkit', specifically the visual profile plot tools.
- Open the '1D Integrity Tool' from the TUFLOW Plugin toolbar.
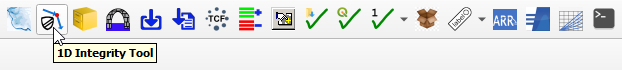
- The resulting dialog will appear.
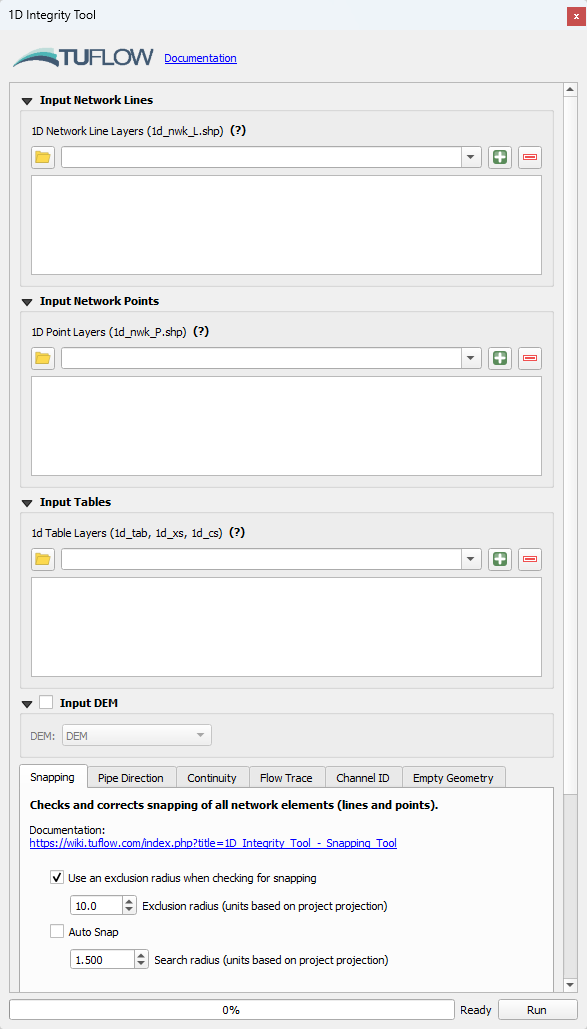
- Set up the tool for this model:
- Input Network Lines: Use the dropdown box and select Links--Conduits. Click the '+' button to add the layer as an input to the tool.
- Input Network Points: Using the same process as above, add Nodes--Junctions and Nodes--Outfalls to the tool.
- Input Tables: Leave blank as it is not used for SWMM data review.
- Input DEM: Tick on and use the dropdown box to select TS02_5m_001_DEM_Z.


Note: For further information on the 1D Integrity Tool and its functionality, see 1D Integrity Tool.
The following example demonstrates the 'Flow Trace' tool. It will be used to create a profile plot for visual review of the 1D pipe network data input.
- In the QGIS Layers Panel, select (left click) Links--Conduits.
- Use the 'Select Features' tool to select conduit 'Pipe15'.
- At the bottom of the 1D Integrity tool dialog, there is a list of tools. Select the 'Flow Trace' tab.
- Enter the following options:
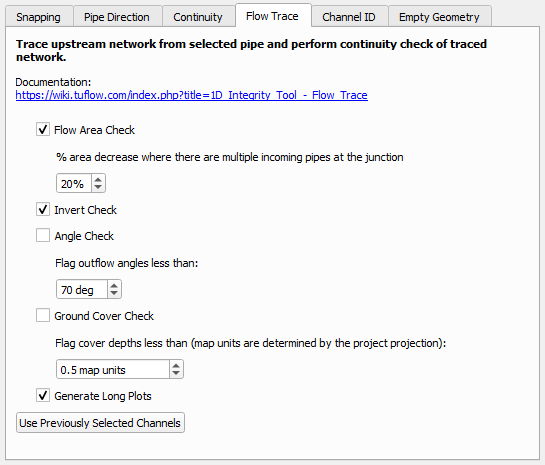
- Click 'Run'.
- The tool will select all the upstream conduits and also add another output layer identifying the locations which fail the flow area and invert checks.
- A Flow Trace window will appear. It provides a 'long plot' of the long sections of the various upstream paths from the selected conduit, highlighting the areas of continuity failures. The plot should be consistent with the output GIS layer that is also generated by the flow trace tool.

| Up |
|---|