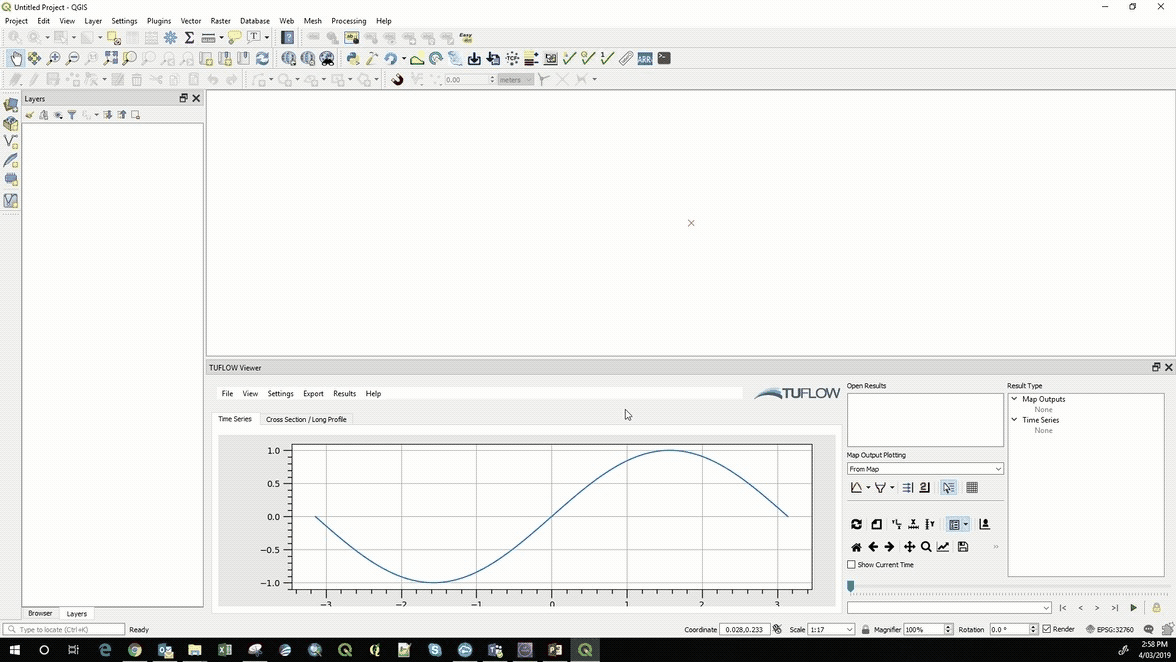
TUFLOW Viewer
TUFLOW Viewer
TUFLOW Viewer replaces Crayfish and TUPLOT as the TUFLOW result viewer for QGIS for version 3.6 onwards. It uses the Mesh Data Abstraction Library (MDAL) available in QGIS to display and interact with TUFLOW map output results, and the TUFLOW results python library (the same library used by TUPLOT in earlier versions of QGIS) for viewing TUFLOW time series results.
How To Use
Basics
Some of the basic functionality are listed below this section and describe how to:
- Load Results
- Change Result Type
- Show Maximum
- Show Vectors
- Style Layer
- Save As Default Style
- Plot From Map Outputs
- Plot From Time series Output
- Use a Secondary Axis
- Change Plot Properties
- Export The Plot as an Image or CSV (coming soon)
Advanced
Some more advanced use is described in the following pages:
- Animations (coming soon)
- Maps (coming soon)
- Using a Date Axis (coming soon)
- Importing Calibration Data (coming soon)
- Batch Exporting Plots (coming soon)
Getting a Python Error
Occasionally the TUFLOW plugin will throw an exception and this will produce a Python Error which is displayed either as a yellow banner at the top of the map window or a window may appear stating than an 'Error has occurred while executing Python code'.
![]()
What Does This Mean?
This means that the TUFLOW plugin has encountered something unusual or a situation that it does not know how to handle i.e. it has reached a line in the code that has failed to execute and as a consequence Python has bailed out. This means that all the code below this point has not been executed that was meant to be. This can have knock on consequences as variables may not exist or be set to incorrect values and signal handling (e.g. what happens when a a menu item is clicked) is broken. So a python error can lead to further python errors that would normally not occurred, so the first python error is usually the most important.
What To Do
- Email the Stack Trace to support@tuflow.com with a description of the steps that produced the python error (as best you can describe it)
- If you find that you are now experiencing a lot of python errors (probably caused by the initial error) you can try the following in order of
Loading Results
Option 1
- File >> Load Results
Option 2
- Right Click in Open Results >> Load Results
There are 3 options for loading in results:- Load Results --> This is done via a TCF, TLF, or FVC file and will load in all results (Map Outputs and Time Series)
- Load Results - Map Outputs --> Select map output mesh results file (*.xmdf, *.dat, *.2dm, *.xmdf.sup, *.dat.sup)
- Load Results - Time Series --> Select time series output results (*.tpc)
Changing Result Type
As simple as selecting a different result type in Result Type panel. You can only display one Scalar results and one Vector result at any given time.
File:ChangingResultType.gif
Showing Maximum
Option 1
- Click the double up arrow next to the result type
Option 2
- Right click the result type >> Check on Maximum
Showing Vectors
Select one of the Vector result types in the Result Types panel
File:ToggleVectors.gif
Styling Layer
Option 1
- Right Click mesh layer in Layers Panel >> Properties... >> Navigate to the Contour Tab at the top >> Select Colour Ramp in drop down box >> Click Load >> Click OK
Option 2
- Right Click result type in Result Type Panel >> Properties... >> Navigate to the Contour Tab at the top >> Select Colour Ramp in drop down box >> Click Load >> Click OK
Saving Default Style
Saving a default style for a result type will mean that every time a result type of that name e.g 'Depth' is loaded, TUFLOW Viewer will automatically apply that style.
There are 2 options:- Save Colour Ramp --> This will save the particular colour ramp as default. This means the actual min / max values will be adjusted based on the results. This is useful for results such as Bed Elevation or Water Level where the ranges are usually different depending on the model's location
- Save Colour Map --> This will save the exact values and associated colours used in the styling. This might be useful for results such as Depth or Velocity where a template can be applicable across different models
- Right Click the result type >> Save Style As Default >> Colour Ramp
Plotting From Map Outputs
Time Series
You can plot one or multiple temporal map output results as a time series.
- Choose which map outputs to plot --> click on the time series graph down arrow under Map Output Plotting >> Check on desired result types
- Click off the menu
- Click the time series graph again (not the down arrow)
- Click somewhere on your results
Cross Section
You can plot one or multiple map output results as a cross section for the current time step.
- Choose which map outputs to plot --> click on the cross-section graph down arrow under Map Output Plotting >> Check on desired result types
- Click off the menu
- Click the cross-section graph again (not the down arrow)
- Left click somewhere on your results to start the cross-section
- Left click to add vertices to your cross-section polyline
- Right click to finish
Plotting Flow
You can post calculate flow from the map output results. Note that this approach should be used for approximation only. The preferred method is to use a PO line in TUFLOW.
- Click on the Plot Flux button down arrow under Map Output Plotting
- Left click somewhere on your results to start the flux line
- Left click to add vertices to your flux line
- Right click to finish
The direction convention is the same as PO lines in TUFLOW - the positive direction of flow is from left bank to right bank looking downstream
File:MapOutputPlotting Q.gif
Plotting From Time Series Outputs
If time series results are loaded in (e.g. 1D results) you can plot from the outputted types.
- Select result type e.g Flow under the Time Series section in the Result Types
- Use QGIS Select Tool and select one of the PLOT GIS features
Using a Secondary Axis
If you are plotting multiple result types at once, you may want to plot one or more of the lines on a secondary axis. This can be done 2 ways:
Option 1- Click the Secondary Axis icon on the appropriate result type in the Result Types Panel
Option 2
- Right Click on the appropriate result type in the Result Types Panel and check on Secondary Axis
Changing Plot Properties
Plot properties can be changed via
Option 1- TUFLOW Viewer Settings >> Customise
Option 2
- Customise tool icon in the plot toolbar
Using this, properties such as the plot axis, item name in legend, and line / point styling can be modified.
File:PlotProperties 1.gif
File:PlotProperties 2.gif
File:PlotProperties 3.gif
File:PlotProperties 4.gif
- File >> Load Results
