Difference between revisions of "TUFLOW Viewer - Exporting An Animation"
Jump to navigation
Jump to search
Ellis Symons (talk | contribs) |
Ellis Symons (talk | contribs) |
||
| Line 24: | Line 24: | ||
<li> '''Target Duration''' - Animation duration - this setting is ignored if using the 'old method' | <li> '''Target Duration''' - Animation duration - this setting is ignored if using the 'old method' | ||
</ol> | </ol> | ||
| + | <li> On the layout tab, the user has the option to use a '''Default Layout''' or a '''Custom Layout'''. A cusom layout uses a '''Print Layout Template (.qpt)''' as an input. The recommended workflow is to: | ||
| + | <ol> | ||
| + | <li> Use the '''Default Layout''' as a starting point | ||
| + | <li> Customise the layout using the print layout in QGIS | ||
| + | <li> Export the print layout as a template (.qpt) | ||
| + | <li> Use '''Custom Layout''' using the template file | ||
| + | </ol> | ||
| + | <li> Assuming the above workflow, the '''Default Layout''' lets the user specify some items to add to the layout | ||
| + | <li> Starting with the first three, each of these has the ability to add an additional label to the item and set properties such as the font, background colour, background border, and position in the layout: | ||
| + | <ol> '''Title''' - Text that will be added to the layout - can be added later in the print layout | ||
| + | <ol> '''Time''' - Dynamic text to show the current time - will use date-time format if '''Show as dates''' is on. This can be added later, however it's recommended to add it through the '''Default Layout'''. It can be added later manually in the print layout by adding a '''label''' item and giving it an id 'time' (note id is not the same as the label text). | ||
| + | <li> '''Legend''' - A legend item - can be added / modified later in the print layout | ||
| + | </ol> | ||
| + | <li> The next layout item is '''plots'''. These are dynamic plot objects that will be added to the animation. | ||
</ol> | </ol> | ||
Revision as of 02:51, 23 April 2021
Tool Description
Animations can be exported from TUFLOW Viewer for all accepted result types (map outputs, time series, particles etc). The process for animation creation is the same regardless of the result type and leverages the QGIS print layout. The tool will export an image for each timestep in a given range and then use ffmpeg to convert the images into a video. TUFLOW Viewer offers the additional functionality of adding dynamic plots and dynamic time text. It also offers convenience functionality for adding items such as a legend, images etc, however these can also be added manually in the print layout.
The following steps through the process of creating an animation with TUFLOW Viewer.
- Download ffmpeg - https://ffmpeg.org/download.html
- ffmpeg is a free and powerful (and open source) video converter and manipulator. TUFLOW Viewer will call ffmpeg as the last step to create the video
- TUFLOW Viewer will take care of all the interaction with ffmpeg and the user is not required to learn how to use ffmpeg
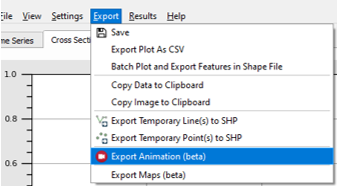
- Open the export animation tool via Export >> Export Animation
- Set the General settings
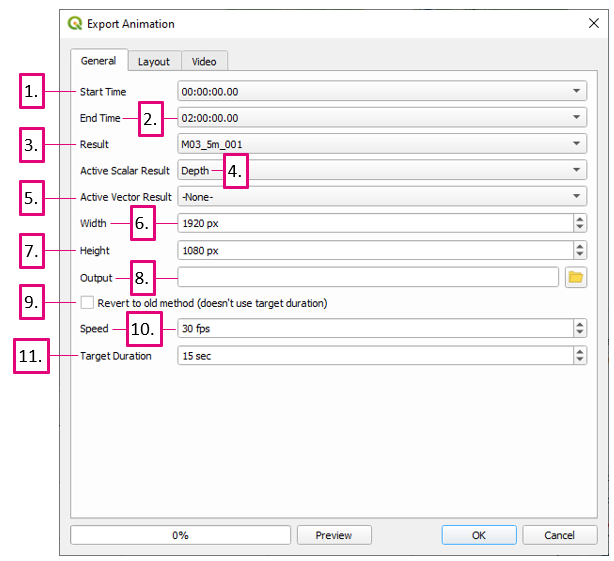
- Start Time - The output time to start on
- End Time - The output time to end on
- Result - The result to animate - currently can only animate one result (result types with the same name (time series, particles - particles will have _ptm in its name) will be included in the same animation
- Active Scalar Result - Active scalar result type to animate - can only choose one, can select -None- to not use any
- Active Vector Result - Active vector result type to animate - can only choose one, can select -None- to not use any
- Width - Animation video width - can be changed later in the print layout - will be overriden by template if one is specified
- Height - Animation video height - can be changed later in the print layout - will be overriden by template if one is specified
- Output - Output location of video file
- Revert to old method - Kept for backward compatibility - will ignore Target Duration and the duration will be determined by number of output timesteps (i.e. the frames) and the speed
- Speed - Animation video frames per second (fps) - unless using the 'old method' this will not affect the video duration. Will not interpolate between frames, however can still produce a smoother video in some situations over the 'old method'
- Target Duration - Animation duration - this setting is ignored if using the 'old method'
- On the layout tab, the user has the option to use a Default Layout or a Custom Layout. A cusom layout uses a Print Layout Template (.qpt) as an input. The recommended workflow is to:
- Use the Default Layout as a starting point
- Customise the layout using the print layout in QGIS
- Export the print layout as a template (.qpt)
- Use Custom Layout using the template file
- Assuming the above workflow, the Default Layout lets the user specify some items to add to the layout
- Starting with the first three, each of these has the ability to add an additional label to the item and set properties such as the font, background colour, background border, and position in the layout:
- Title - Text that will be added to the layout - can be added later in the print layout
- Legend - A legend item - can be added / modified later in the print layout
- The next layout item is plots. These are dynamic plot objects that will be added to the animation.
- Time - Dynamic text to show the current time - will use date-time format if Show as dates is on. This can be added later, however it's recommended to add it through the Default Layout. It can be added later manually in the print layout by adding a label item and giving it an id 'time' (note id is not the same as the label text).
Examples
Links
Similar Tools
Back to TUFLOW Viewer Page

