Difference between revisions of "TUFLOW Viewer - Extracting Median And Mean Time Series"
Jump to navigation
Jump to search
Ellis Symons (talk | contribs) |
Ellis Symons (talk | contribs) |
||
| Line 6: | Line 6: | ||
<li> Toggle on one, or both of, '''Show Median Event''' and '''Show Mean Event''' | <li> Toggle on one, or both of, '''Show Median Event''' and '''Show Mean Event''' | ||
<li> The time series plot should automatically update to show the resulting events. | <li> The time series plot should automatically update to show the resulting events. | ||
| − | <li> The source of the resulting event(s) will be labelled in the plot legend | + | <li> The source of the resulting event(s) will be labelled in the plot legend<br> |
[[File: Plotting_MedianMean_Legend.PNG]] | [[File: Plotting_MedianMean_Legend.PNG]] | ||
</ol> | </ol> | ||
Revision as of 00:54, 20 April 2021
Tool Description
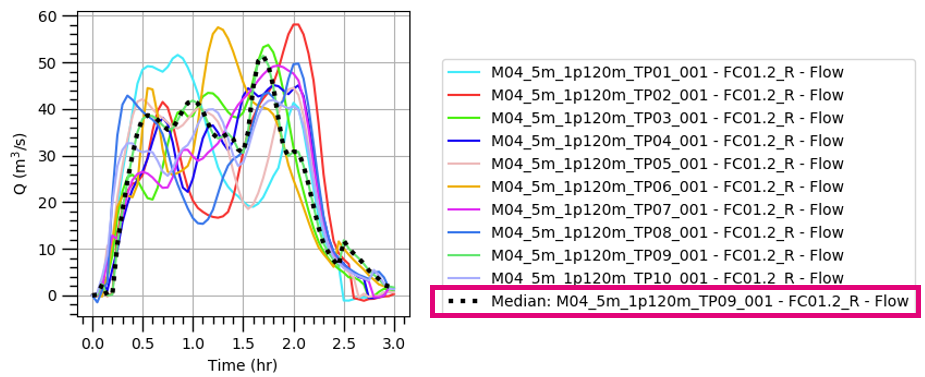
TUFLOW Viewer offers the ability to pull out the median and / or mean time series from the plot window. The steps to do this are:
- Results >> ARR2019
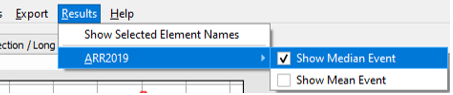
- Toggle on one, or both of, Show Median Event and Show Mean Event
- The time series plot should automatically update to show the resulting events.
- The source of the resulting event(s) will be labelled in the plot legend