TUFLOW Viewer - Extracting Median And Mean Time Series
Tool Description
TUFLOW Viewer offers the ability to pull out the median and/or mean time series from the plot window. The tool will extract the chosen statistic from all plotted results based on the maximum value extracted from the time series, so the user should ensure they only have one element selected and all of (and only) the relevant events selected in the Open Results widget (i.e. for ARR only one AEP/duration combination and all 10 temporal patterns).
- Results >> ARR2019
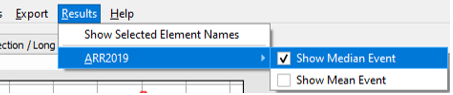
- Toggle on one, or both of, Show Median Event and Show Mean Event.
- The time series plot should automatically update to show the resulting events.
- The source of the resulting event(s) will be labelled in the plot legend.
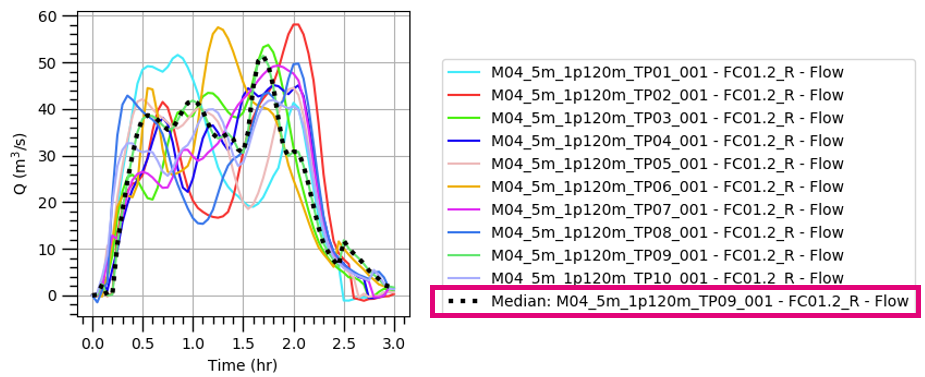


Median: The median event is based on a peak flow. If there are an even number of events, the median rank is rounded up. For example, if there are 10 results, the median will be the 6th ranked event.
Mean: The mean event is based on the mathematical mean of peak flows, but will always select an actual event. By default this is chosen to be the next higher. This can be changed to closest in Settings >> Options >> Plotting and setting Mean Event Selection to 'closest'.

Example

| Up |
|---|