Difference between revisions of "TUFLOW Viewer - Import 1D ESTRY Cross - Sections"
(→Tool) |
|||
| Line 1: | Line 1: | ||
| − | ===Tool=== | + | ===Tool Description=== |
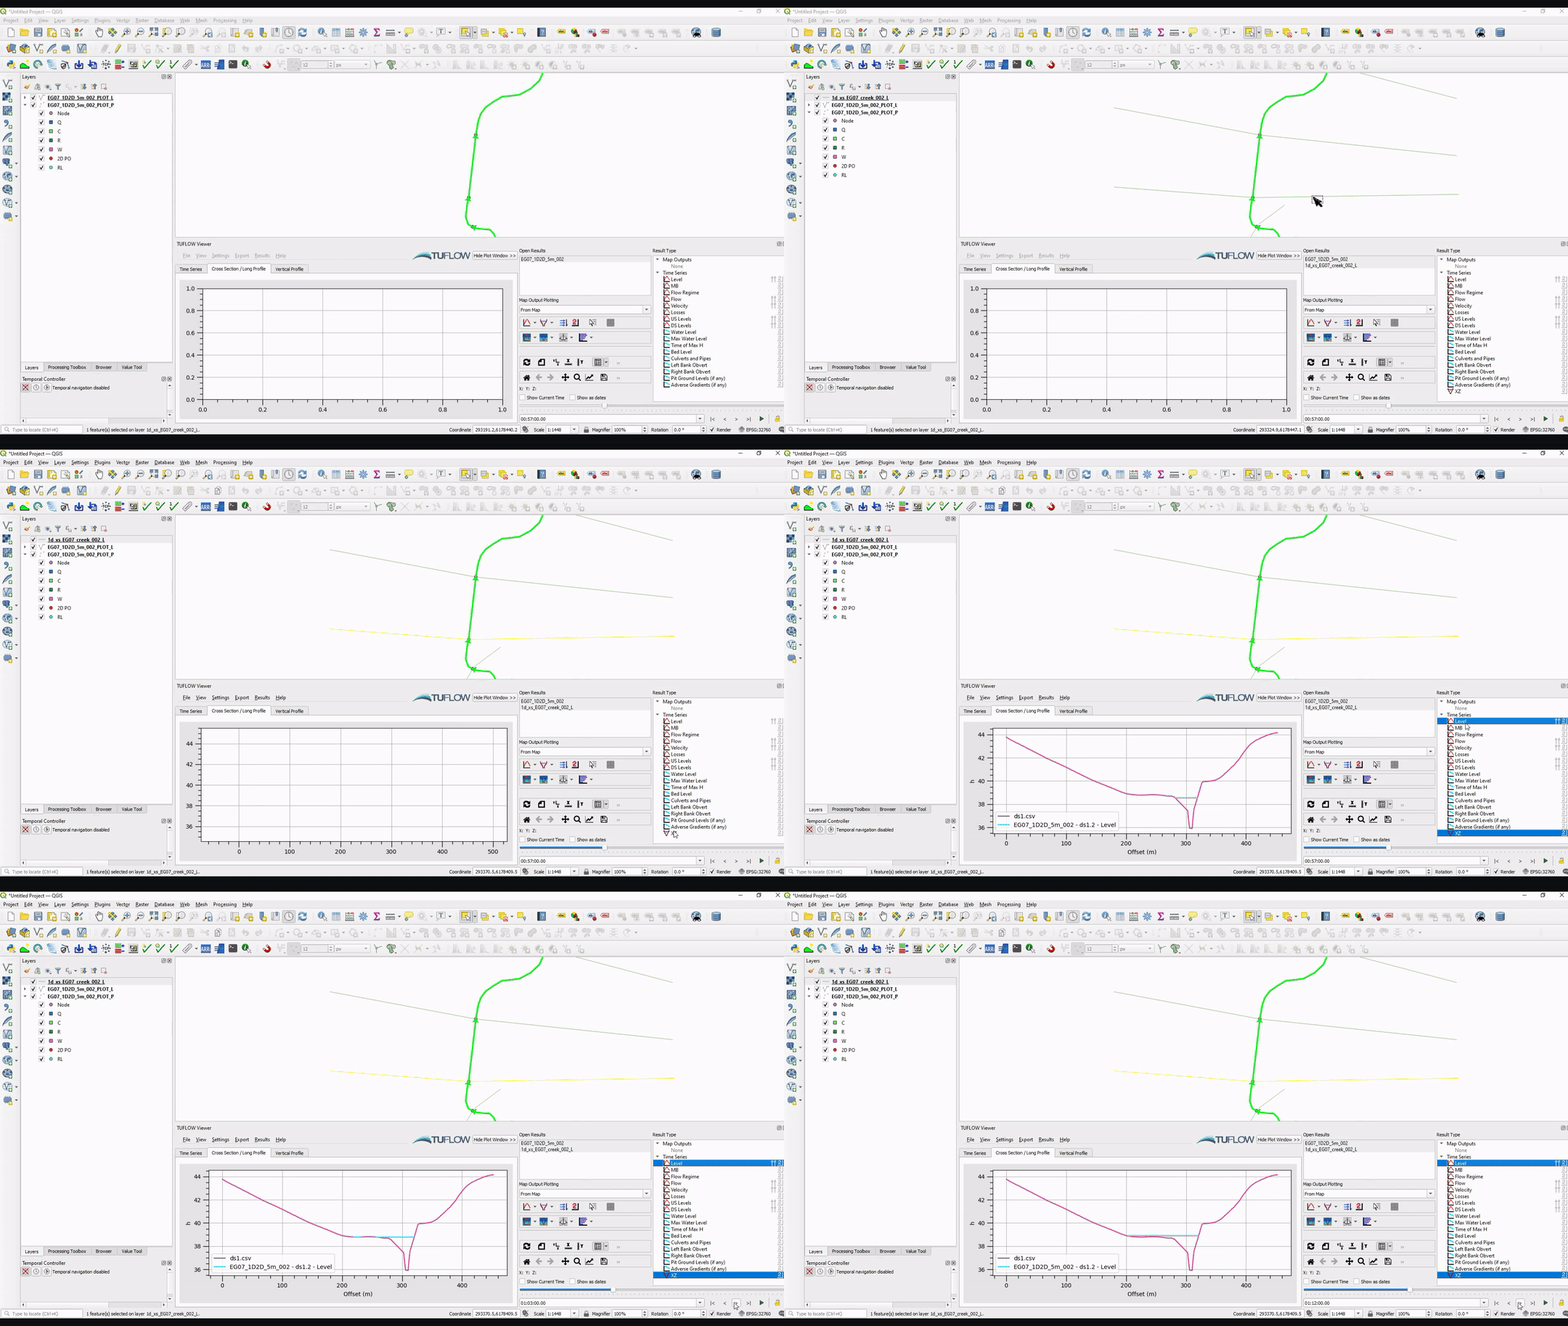
This will automatically happen if an appropriate TUFLOW input is opened in QGIS while TUFLOW Viewer is open (e.g. 1d_xs). It will also be loaded if the layer is already present in QGIS when TUFLOW Viewer is opened. The user can view the cross-section by clicing the appropriate result type in TUFLOW Viewer and selecting the desired cross-section feature in QGIS. To view the cross-section the user must be on the "Cross Section / Long Profile" plotting tab.<br><br> | This will automatically happen if an appropriate TUFLOW input is opened in QGIS while TUFLOW Viewer is open (e.g. 1d_xs). It will also be loaded if the layer is already present in QGIS when TUFLOW Viewer is opened. The user can view the cross-section by clicing the appropriate result type in TUFLOW Viewer and selecting the desired cross-section feature in QGIS. To view the cross-section the user must be on the "Cross Section / Long Profile" plotting tab.<br><br> | ||
Water level results will be displayed on the cross-section if the time series results have also been imported. The water level will dynamically update with the model time or show maximum if the water level time series result is set to maximum. This can be used in conjuction with the 1D hydraulic tables to view the cross section properties. | Water level results will be displayed on the cross-section if the time series results have also been imported. The water level will dynamically update with the model time or show maximum if the water level time series result is set to maximum. This can be used in conjuction with the 1D hydraulic tables to view the cross section properties. | ||
| + | |||
===Example=== | ===Example=== | ||
[[File: Import_CrossSections.gif]] | [[File: Import_CrossSections.gif]] | ||
Revision as of 12:33, 20 May 2021
Tool Description
This will automatically happen if an appropriate TUFLOW input is opened in QGIS while TUFLOW Viewer is open (e.g. 1d_xs). It will also be loaded if the layer is already present in QGIS when TUFLOW Viewer is opened. The user can view the cross-section by clicing the appropriate result type in TUFLOW Viewer and selecting the desired cross-section feature in QGIS. To view the cross-section the user must be on the "Cross Section / Long Profile" plotting tab.
Water level results will be displayed on the cross-section if the time series results have also been imported. The water level will dynamically update with the model time or show maximum if the water level time series result is set to maximum. This can be used in conjuction with the 1D hydraulic tables to view the cross section properties.
Example
| Up |
|---|
