Difference between revisions of "TUFLOW Viewer - Importing a User Defined Time Series To Display On The Plot"
Jump to navigation
Jump to search
Ellis Symons (talk | contribs) |
Chris Huxley (talk | contribs) |
||
| (3 intermediate revisions by the same user not shown) | |||
| Line 1: | Line 1: | ||
===Tool Description=== | ===Tool Description=== | ||
| − | It | + | It's possible to import external data into the plotting window(s) to display alongside plotted results. This can be useful, for example during model calibration testing when comparing model results against gauge recordings.<Br> |
Steps to import data: | Steps to import data: | ||
<ol> | <ol> | ||
| − | <li> Open the '''User Plot Data Manager''' via '''Settings''' Menu<br> | + | <li> Open the '''User Plot Data Manager''' via the '''Settings''' Menu<br> |
[[File: Plotting_User_Plot_Data_Manager.PNG]] | [[File: Plotting_User_Plot_Data_Manager.PNG]] | ||
<li> Select '''Add Data''' | <li> Select '''Add Data''' | ||
| − | <li> Use the import wizard to pass in text data<br> | + | <li> Use the import wizard to pass in text data:<br> |
| − | |||
<ol> | <ol> | ||
| − | <li> '''Delimiter File''' - File containing the data to be imported | + | <li> '''Delimiter File''' - File containing the data to be imported. |
| − | <li> '''Delimited Format''' - Character / symbol delimiting the data | + | <li> '''Delimited Format''' - Character / symbol delimiting the data. |
| − | <li> '''Number of Header Rows to Discard''' - The number of rows at the top of the file to ignore | + | <li> '''Number of Header Rows to Discard''' - The number of rows at the top of the file to ignore. |
| − | <li> '''Use Header Line as Data Labels''' - Uses row values as labels for the imported data series. This can be changed later after the import is complete. | + | <li> '''Use Header Line as Data Labels''' - Uses row values as labels for the imported data series. This can be changed later after the import is complete. The user must choose which header row to use as labels if more than one is available. |
<li> '''X Column / Y Column''' - Column containing the X and Y values. User can choose multiple Y columns. | <li> '''X Column / Y Column''' - Column containing the X and Y values. User can choose multiple Y columns. | ||
<li> '''Null Value''' - Value to be treated as null. Note, blank values will always be treated as null. | <li> '''Null Value''' - Value to be treated as null. Note, blank values will always be treated as null. | ||
| Line 19: | Line 18: | ||
<li> '''US date format''' - Tick this box on if the tool is interpreting month and day incorrectly. Generally this will be dependent on the input format and the computer settings. | <li> '''US date format''' - Tick this box on if the tool is interpreting month and day incorrectly. Generally this will be dependent on the input format and the computer settings. | ||
<li> '''Manually Specify Zero Date Time''' - Input a reference time for conversion to relative time. If left blank, the tool will use the first valid (non-null) entry as the reference time. | <li> '''Manually Specify Zero Date Time''' - Input a reference time for conversion to relative time. If left blank, the tool will use the first valid (non-null) entry as the reference time. | ||
| + | [[File: Plotting_User_Plot_Data_Import_Wizard.PNG]] | ||
</ol> | </ol> | ||
| − | <li> Review the preview - click '''OK''' when ready | + | <li> Review the preview - click '''OK''' when ready. |
| − | <li> Specify which plot tab to plot the data | + | <li> Specify which plot tab to plot the data to:<br> |
[[File: Plotting_User_Plot_Data_Manager_PlotType.PNG]] | [[File: Plotting_User_Plot_Data_Manager_PlotType.PNG]] | ||
| − | <li> Click '''OK''' | + | <li> Click '''OK'''. |
</ol> | </ol> | ||
<br> | <br> | ||
It is possible to review the data in the '''User Plot Data Manager''' by selecting the data in the table and selecting either: | It is possible to review the data in the '''User Plot Data Manager''' by selecting the data in the table and selecting either: | ||
| − | * '''View Data''' - Will display the data in a table. It is possible to edit the data in the table, however it won't be a very efficient method of bulk editing as | + | * '''View Data''' - Will display the data in a table. It is possible to edit the data in the table, however it won't be a very efficient method of bulk editing as this feature has not been created for this purpose. It's probably easier to do editing in Excel / Python etc. and re-import once the changes have been made. |
* '''Plot Data''' - Will display the data as a plot.<br> | * '''Plot Data''' - Will display the data as a plot.<br> | ||
It is possible to change the dataset name, toggle the visibility of the data, or remove the data in the '''User Plot Data Manager'''.<br> | It is possible to change the dataset name, toggle the visibility of the data, or remove the data in the '''User Plot Data Manager'''.<br> | ||
| − | === | + | ===Example=== |
[[File: Plotting_User_Plot_Data_Import_Example.gif]] | [[File: Plotting_User_Plot_Data_Import_Example.gif]] | ||
| − | + | <br><br> | |
| − | + | {{Tips Navigation | |
| − | + | |uplink=[[TUFLOW_Viewer#Loading_Results| Back to TUFLOW Viewer Main Page]] | |
| − | + | }} | |
| − | |||
| − | |||
| − | |||
| − | |||
| − | |||
| − | |||
| − | |||
Latest revision as of 13:27, 2 June 2021
Tool Description
It's possible to import external data into the plotting window(s) to display alongside plotted results. This can be useful, for example during model calibration testing when comparing model results against gauge recordings.
Steps to import data:
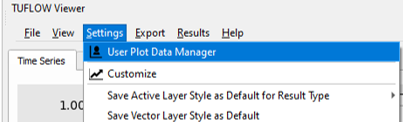
- Open the User Plot Data Manager via the Settings Menu
- Select Add Data
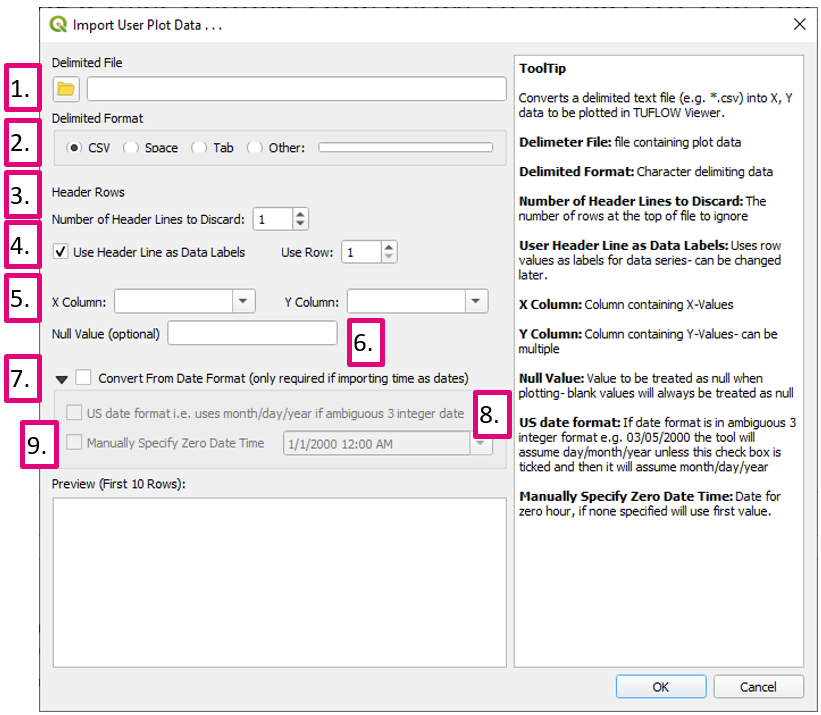
- Use the import wizard to pass in text data:
- Delimiter File - File containing the data to be imported.
- Delimited Format - Character / symbol delimiting the data.
- Number of Header Rows to Discard - The number of rows at the top of the file to ignore.
- Use Header Line as Data Labels - Uses row values as labels for the imported data series. This can be changed later after the import is complete. The user must choose which header row to use as labels if more than one is available.
- X Column / Y Column - Column containing the X and Y values. User can choose multiple Y columns.
- Null Value - Value to be treated as null. Note, blank values will always be treated as null.
- Convert From Date Format - This step is required if the X data is in date format. This step will convert the date format to a relative time.
- US date format - Tick this box on if the tool is interpreting month and day incorrectly. Generally this will be dependent on the input format and the computer settings.
- Manually Specify Zero Date Time - Input a reference time for conversion to relative time. If left blank, the tool will use the first valid (non-null) entry as the reference time.
- Review the preview - click OK when ready.
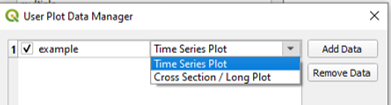
- Specify which plot tab to plot the data to:
- Click OK.


It is possible to review the data in the User Plot Data Manager by selecting the data in the table and selecting either:
- View Data - Will display the data in a table. It is possible to edit the data in the table, however it won't be a very efficient method of bulk editing as this feature has not been created for this purpose. It's probably easier to do editing in Excel / Python etc. and re-import once the changes have been made.
- Plot Data - Will display the data as a plot.
It is possible to change the dataset name, toggle the visibility of the data, or remove the data in the User Plot Data Manager.
Example

| Up |
|---|