Difference between revisions of "TUFLOW Viewer - Map Outputs - 3D to 2D Depth Averaged Time Series"
Chris Huxley (talk | contribs) |
Chris Huxley (talk | contribs) |
||
| Line 20: | Line 20: | ||
[[File: Plotting_MapOutput_DepAv_TimeSeries.gif]] | [[File: Plotting_MapOutput_DepAv_TimeSeries.gif]] | ||
<br><br> | <br><br> | ||
| − | |||
| − | |||
| − | |||
| − | |||
| − | |||
| − | |||
| − | |||
| − | |||
| − | |||
| − | |||
| − | |||
| − | |||
| − | |||
| − | |||
| − | |||
| − | |||
{{Tips Navigation | {{Tips Navigation | ||
| − | |uplink=[[TUFLOW_Viewer# | + | |uplink=[[TUFLOW_Viewer#Map_Output| Back to TUFLOW Viewer Main Page]] |
}} | }} | ||
Latest revision as of 14:58, 2 June 2021
Tool Description
Extracts 3D to 2D depth averaged time series results from a point from the map outputs. Users can choose multiple methods and/or multiple instances of the same method with different parameters to plot at once. This tool expands on the time series plotting tool for 3D results as it lets users plot one or multiple 3D to 2D depth averaging methods at the same time (for example plot results from vertical layer 1, 2, 3.. etc). The standard timeseries plotting tool will plot only the current 3D to 2D depth averaging method being used to render the results.
For 2D depth averaged model results (i.e. TUFLOW Classic / HPC) the 3D to 2D depth averaging methods will have no affect and produce identical result to each other.
To use the tool:
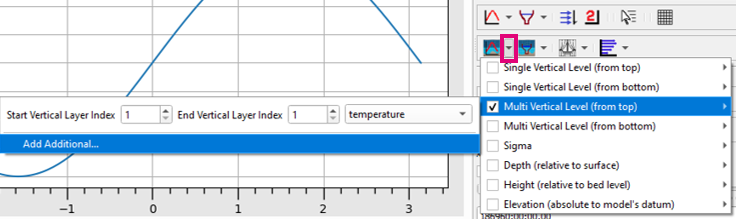
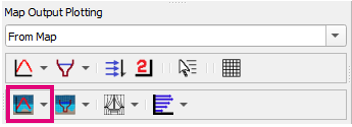
- Select the dropdown arrow next to the 3D to 2D Depth Averaged Time Series icon.
- Select (tick on) the 3D to 2D depth averaging method(s) - input appropriate parameters for the method and select the desired result type in the dropdown box.
- Click off the drop down menu somewhere in a blank section of the TUFLOW Viewer toolbar.
- Click the 3D to 2D Depth Averaged Time Series icon so that it becomes indented and the cursor changes to a crosshair.
- Select a location on the map outputs to plot from.


To plot multiple instances of the same depth averaging method with different result types or different parameters, select Add Additional... in the dropdown menu. To exclude additional methods from the plot, the methods can be unchecked, or can be removed completely by right clicking the method and selecting Remove Method.
Example

| Up |
|---|