Difference between revisions of "TUFLOW Viewer - Map Outputs - Plotting Flow"
Jump to navigation
Jump to search
Ellis Symons (talk | contribs) (Created page with "File: Plotting_Toolbar_Flux.PNG<br><br> __TOC__ ===Tool Description=== ===Examples=== ===Links=== ====Similar Tools==== * Load Results *...") |
Ellis Symons (talk | contribs) |
||
| Line 2: | Line 2: | ||
__TOC__ | __TOC__ | ||
===Tool Description=== | ===Tool Description=== | ||
| + | Extracts flow time series across a polyline from the map outputs. For 3D map outputs, the tool will use the current 3D to 2D depth average rendering method.<br> | ||
| + | |||
| + | '''This tool should be used for flow approximation only''' | ||
| + | |||
| + | To use the tool: | ||
| + | <ol> | ||
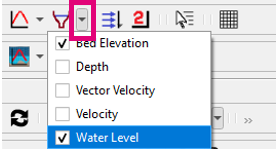
| + | <li> Select which result type to plot using the down arrow next to the cross-section icon in the toolbar<br> | ||
| + | [[File: Plotting_Toolbar_CrossSection_Dropdown.PNG ]] | ||
| + | <li> Click off the drop down menu somewhere in a blank section of the TUFLOW Viewer toolbar | ||
| + | <li> Click the cross-section icon so that it becomes indented and the cursor changes to a crosshair | ||
| + | <li> Left click in the QGIS map window to start drawing a line. Left click to add vertices to the polyline. | ||
| + | <li> Right click to finish drawing your line (note: line must contain at least 2 vertices and right clicking does not add a vertex) | ||
| + | </ol> | ||
===Examples=== | ===Examples=== | ||
===Links=== | ===Links=== | ||
Revision as of 05:22, 2 March 2021

Tool Description
Extracts flow time series across a polyline from the map outputs. For 3D map outputs, the tool will use the current 3D to 2D depth average rendering method.
This tool should be used for flow approximation only
To use the tool:
- Select which result type to plot using the down arrow next to the cross-section icon in the toolbar
- Click off the drop down menu somewhere in a blank section of the TUFLOW Viewer toolbar
- Click the cross-section icon so that it becomes indented and the cursor changes to a crosshair
- Left click in the QGIS map window to start drawing a line. Left click to add vertices to the polyline.
- Right click to finish drawing your line (note: line must contain at least 2 vertices and right clicking does not add a vertex)
